
Employee turnover is the flow of people joining and leaving an organization over a given period. It isn't a problem in itself; it becomes a signal when it affects key people, concentrates in certain functions or speeds up without a visible cause.
Italy's permanent business census (ISTAT) records that more than one Italian small business in three (35.2%) adopted no practice at all to attract or retain qualified staff in 2021-2022 [2]. The figure points more to an opportunity than to a verdict.
The sections that follow clarify the causes, costs, indicators, practical levers and common mistakes.
Before going further, it helps to clarify three distinctions that are often confused. Attrition is the share of natural departures — retirement, end of a project, end of a contract — while turnover includes all departures, including voluntary resignations and early terminations: confusing the two leads you to underestimate the phenomenon. Internal mobility is the movement of people between roles or functions within the same company; turnover is about leaving the company — healthy internal mobility reduces turnover, weak internal mobility feeds it. Finally, functional turnover affects low performers or roles that need redesigning; dysfunctional turnover affects key people and valuable profiles: the first is manageable, the second calls for immediate attention.
Distinguishing worrying turnover from normal turnover
Not all turnover is a problem, and not all stability is an asset. The useful filter runs through three dimensions: who leaves (key person or replaceable), when they leave (within or after the first year), why they leave (controllable or external reasons). Mixing these up produces the wrong reactions — cutting normal departures or tolerating critical ones.
How much turnover is really a problem in a small or mid-sized company, and how much is normal? Reacting to every resignation means spending energy on signals that aren't problems.
A 2×2 matrix helps classify a departure before deciding how to respond.
| Early departure (within 12 months) | Later departure (after 12 months) | |
|---|---|---|
| Key person | Critical signal: requires an immediate diagnosis of the causes | Relevant signal: check for recurring patterns in the function |
| Replaceable person | Moderate signal: check whether onboarding is adequate | Normal: monitor, but not necessarily a problem |
The most critical quadrant is top left: a key person who leaves within the first year signals a problem that may lie in onboarding, in the relationship with their manager or in the gap between what was promised at hiring and the day-to-day reality.
The bottom-right quadrant is generally normal: some later departures of replaceable people are part of an organization's ordinary life cycle. Treating them all as emergencies has a disproportionate impact on the organization.
For the broader framework of managing people, the article on how to manage your people offers useful strategic tools.
Reading the real causes beyond the stated ones
The reasons given in the exit interview rarely match the real ones. The gap between what is said at the time of resignation and what emerges later is a known phenomenon in HR practice, though hard to measure on a representative sample of companies. To read the real causes you need tools that go beyond the closing conversation.
Which tool lets you detect the real causes of turnover without relying on the exit interview alone? A formal exit interview is rarely the moment when a team member tells you what really made them leave.
These tools complement the exit interview and produce more reliable information.
Stay interview. Not the exit interview, but the conversation with people who are still in the company: "What makes you stay here? What would make you consider going elsewhere?" This tool detects potential causes of turnover before they turn into resignations, and it's the richest in practical information.
Pattern analysis by function. If turnover is concentrated in a specific area — all departures in the last two years were in sales, or in manager X's team — the pattern is more informative than the individual reasons given.
Feedback at a distance. Where possible, an informal conversation with people who left 6-12 months earlier can bring out more honest reasons than those given in the exit interview, precisely because the employment relationship is already over.
In Italy in 2024, terminations requested by the worker — about 96% of them resignations — numbered 2,215,570, or 17.4% of all reported terminations [1]. The causes that come up most often in the voluntary resignations we observe:
- Quality of the relationship with the direct manager
- No visible growth opportunities
- Mismatch between expectations at hiring and day-to-day reality
- Pay that isn't competitive with the local market
- Relational climate within the team
It's significant that pay — often named as the main cause — rarely comes up as the primary cause when the other dimensions are satisfied.
Quantifying the costs of turnover, including the invisible ones
The visible costs of turnover — recruiting, initial training, coverage gaps — are often a fraction of the real cost. A complete estimate also includes the loss of tacit knowledge, the extra load on the colleagues who stay and the slowdown of ongoing processes — items no accounting system records as the cost of a departure. Quantifying the invisible costs is the step that turns turnover from "something that happens" into "a manageable risk."
How much does losing a key person really cost a small or mid-sized company? Counting only recruiting and training means underestimating the real cost of the loss.
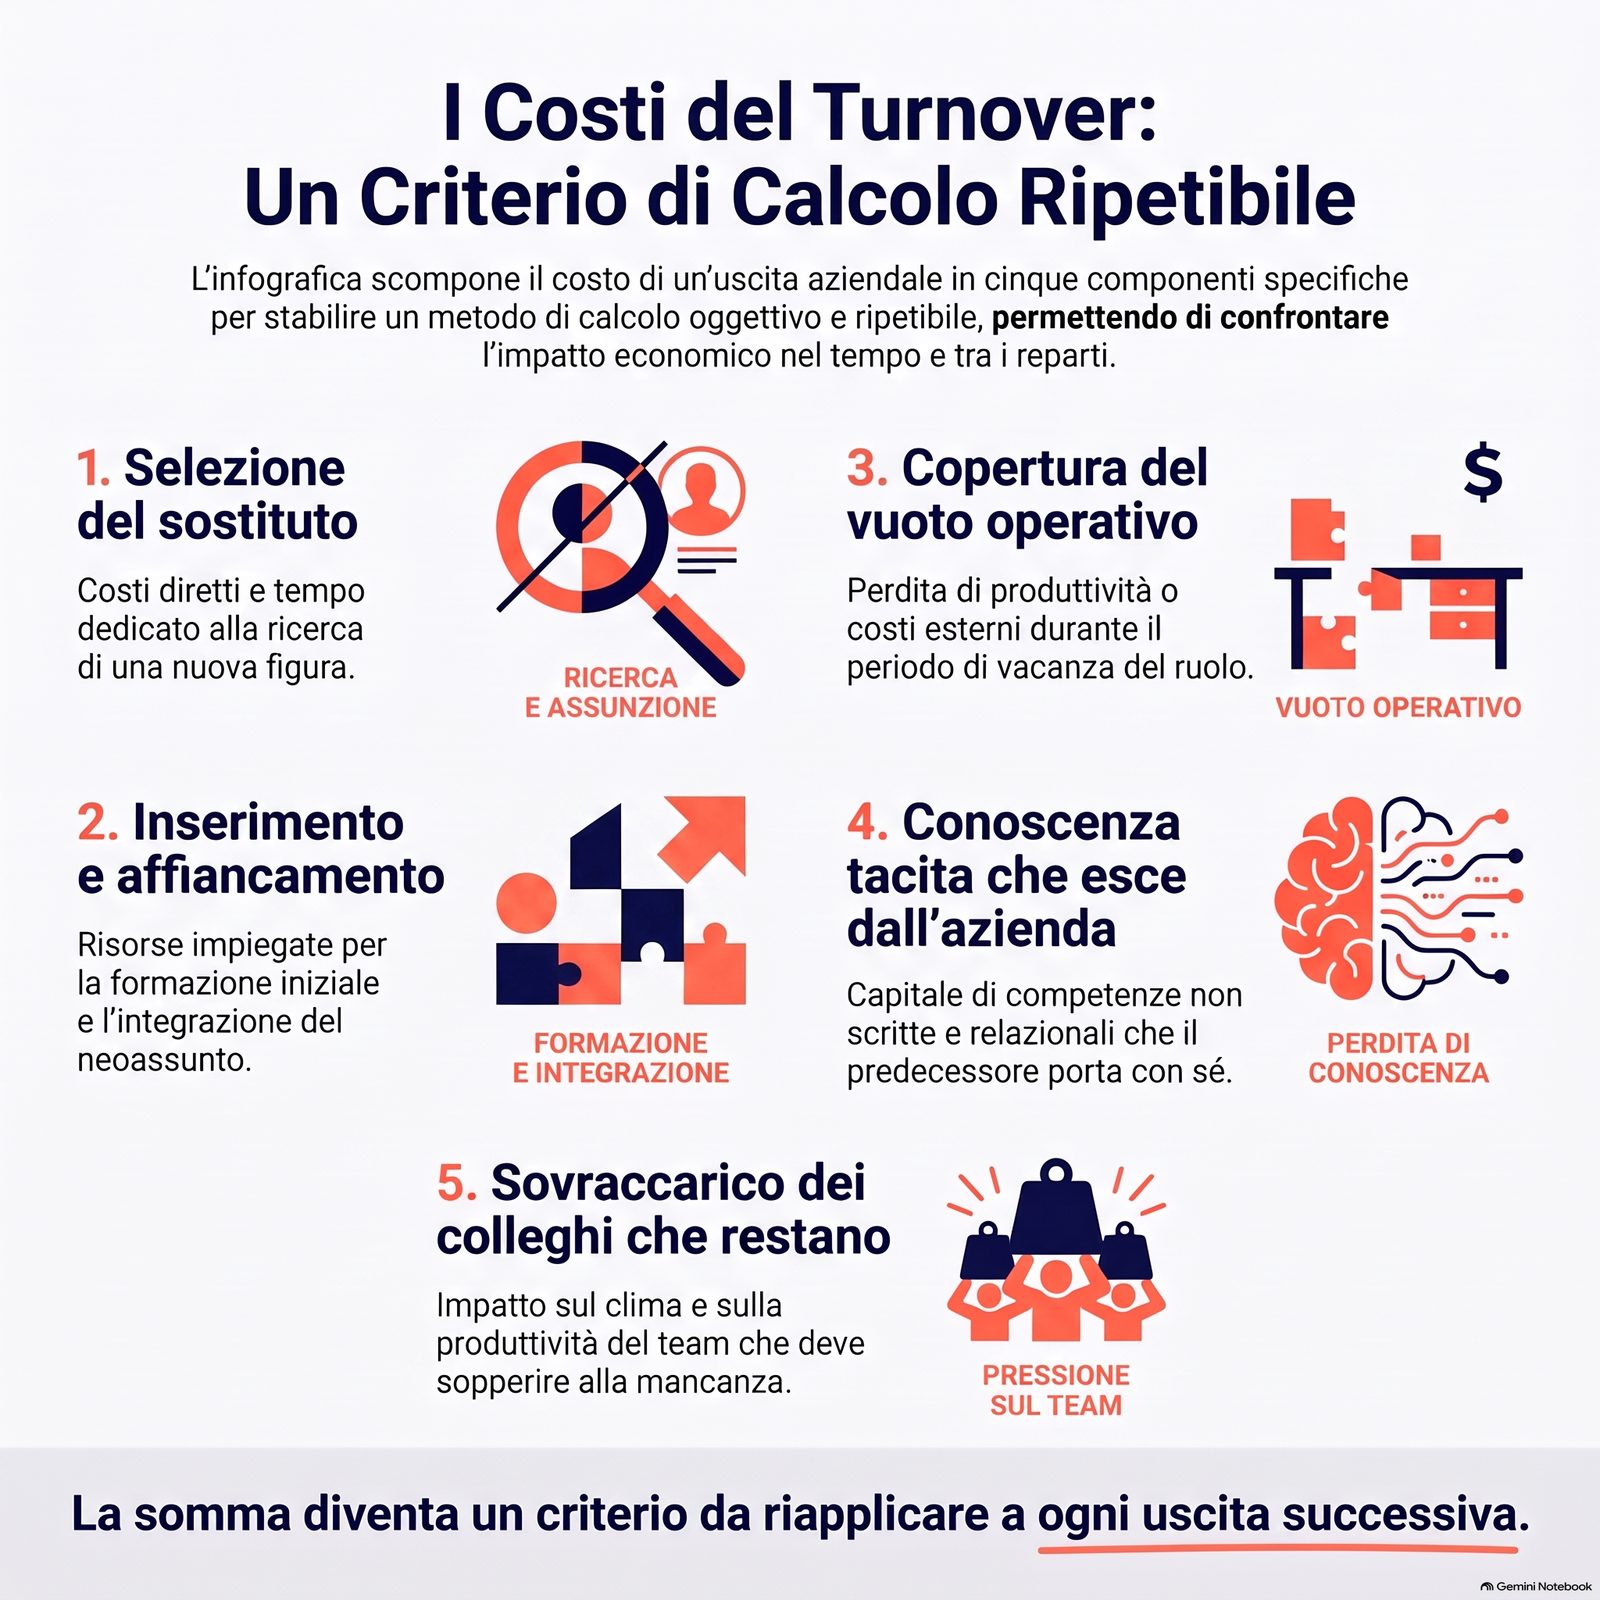
A five-item cost structure helps you build a complete estimate.
1. Recruiting. Internal interview hours, any recruiting costs (job ads, headhunters), management time spent on the process. Easy to quantify.
2. Onboarding and initial training. Shadowing hours, technical training, time the buddy or manager devotes to the new hire. Often underestimated because it's spread across many people in small amounts.
3. Coverage gap. The period between the departure and the replacement becoming fully productive — often 3-6 months for complex roles — creates delays, lower quality and redistribution of the workload onto colleagues. Finding the replacement is also less straightforward than it used to be: in Italy, hiring difficulties affected 47.8% of the hires companies planned in 2024, compared with 26.4% in 2019 [3]. This is often the most significant cost for a smaller company.
4. Loss of tacit knowledge. The implicit procedures, the relationships with customers and suppliers, the undocumented solutions that live in the head of the person leaving. In a company with few formalized processes, this component can be very high: it's the hardest item to quantify and the longest-lasting over time.
5. Extra load on the colleagues who stay. The existing team absorbs the workload of the person who left, often without any formal adjustment. The combined effect of overload and lower work quality can fuel further departures — turnover that generates turnover.
To build these costs into a measurement system, the article on business KPIs offers methods for turning this data into manageable indicators.

Making the cost estimate repeatable with a calculation tool
Once you've broken the cost of a departure down into the five items above, is it worth repeating the same calculation every time you need an estimate, or does the result stay tied to that single case, analyzed once and then filed away?
The difference between a one-off estimate and a repeatable one is the ability to compare over time, across functions and across roles, without redoing the reasoning from scratch every time.
The five-item breakdown above — recruiting, onboarding and initial training, coverage gap, loss of tacit knowledge, extra load on the colleagues who stay — is already a calculation structure, not just a descriptive list.
Making it repeatable means setting, for each of the five items, an estimation criterion you apply with the same steps every time: internal hours multiplied by hourly cost for recruiting, months of coverage gap multiplied by the value of the uncovered role, and so on for the other items.
A manufacturing business owner who loses a specialized shop-floor technician can apply the same calculation structure three months later, when an administrative employee leaves, and get two comparable figures instead of two impressions that are hard to compare.
A repeatable method keeps every new departure from starting the estimate from zero, and over time it builds up an internal point of comparison, more useful than an external benchmark that ignores the specifics of your context.
The hardest component to estimate — the loss of tacit knowledge — can still be quantified with a proxy criterion: the time the replacement takes to reach full autonomy compared with their predecessor, measured on cases already observed in the company.
Applying the same proxy criterion to later cases turns an isolated estimate into an internal time series, which over time sharpens the accuracy of the estimate itself.
A calculation tool structured around these five items — one that collects the same inputs every time and returns a comparable figure — is the most direct way to make the estimate repeatable without relying on memory of how it was done last time.
A repeatable cost estimate prepares the ground for the next section: knowing how much a departure costs becomes more meaningful when you compare it with the overall turnover rate, the number that tells you how many departures to expect in a year.
Calculating the employee turnover rate: where to find the formulas
The overall turnover rate is often mentioned as a summary figure, but how often is it actually calculated with a formula, rather than eyeballed by looking at how many people left this year?
The calculation has its own page: the formulas for incoming, outgoing and overall turnover, the choice of denominator, an example with a small headcount and the checks to run before reading the result are all in the article on calculating the turnover rate.
Here the boundary between the two pages is enough: the rate tells you how many people went through the door in a period, not why — and the why is the subject of this article.
Choosing turnover indicators that guide action
The overall turnover rate is a summary figure that says little unless it's broken down. More useful indicators — rate by function, average tenure by role, share of departures within the first year, replaceability index — describe patterns the aggregate figure hides. Measuring better is the first step toward deciding better.
Which turnover indicators really guide action, and which are merely descriptive? An average turnover rate of 12% can hide 40% in a critical function.
The four practical indicators, with simple formulas.
Turnover rate by function. Calculation: (no. of departures in the area / average headcount of the area) × 100 over the period. Example: 3 departures in a team of 8 people over 12 months = 37.5%. Broken down by function, it identifies the critical areas the overall figure hides.
Departure rate within 12 months. Calculation: (no. of people who left within their first year / no. of people hired in the same period) × 100. This indicator is the one most closely linked to onboarding quality and to the gap between promise and reality. There's no universal threshold that should set off the alarm: the useful reference is the value from previous years in the same company, calculated on the same scope.
Average tenure by role. Calculation: average months of tenure of the people who left a given role in the last 3 years. It identifies structurally unstable roles — those where nobody stays beyond a certain threshold — which call for a review of the role itself, not just of the person.
Share of voluntary vs involuntary departures. Separating chosen departures (resignations) from managed ones (dismissals, end of contract) lets you isolate the attraction/retention signal from ordinary people management.
To integrate these indicators into a broader business performance measurement system, the article on business performance measurement offers a methodological framework.
Activating the practical levers to reduce costly turnover
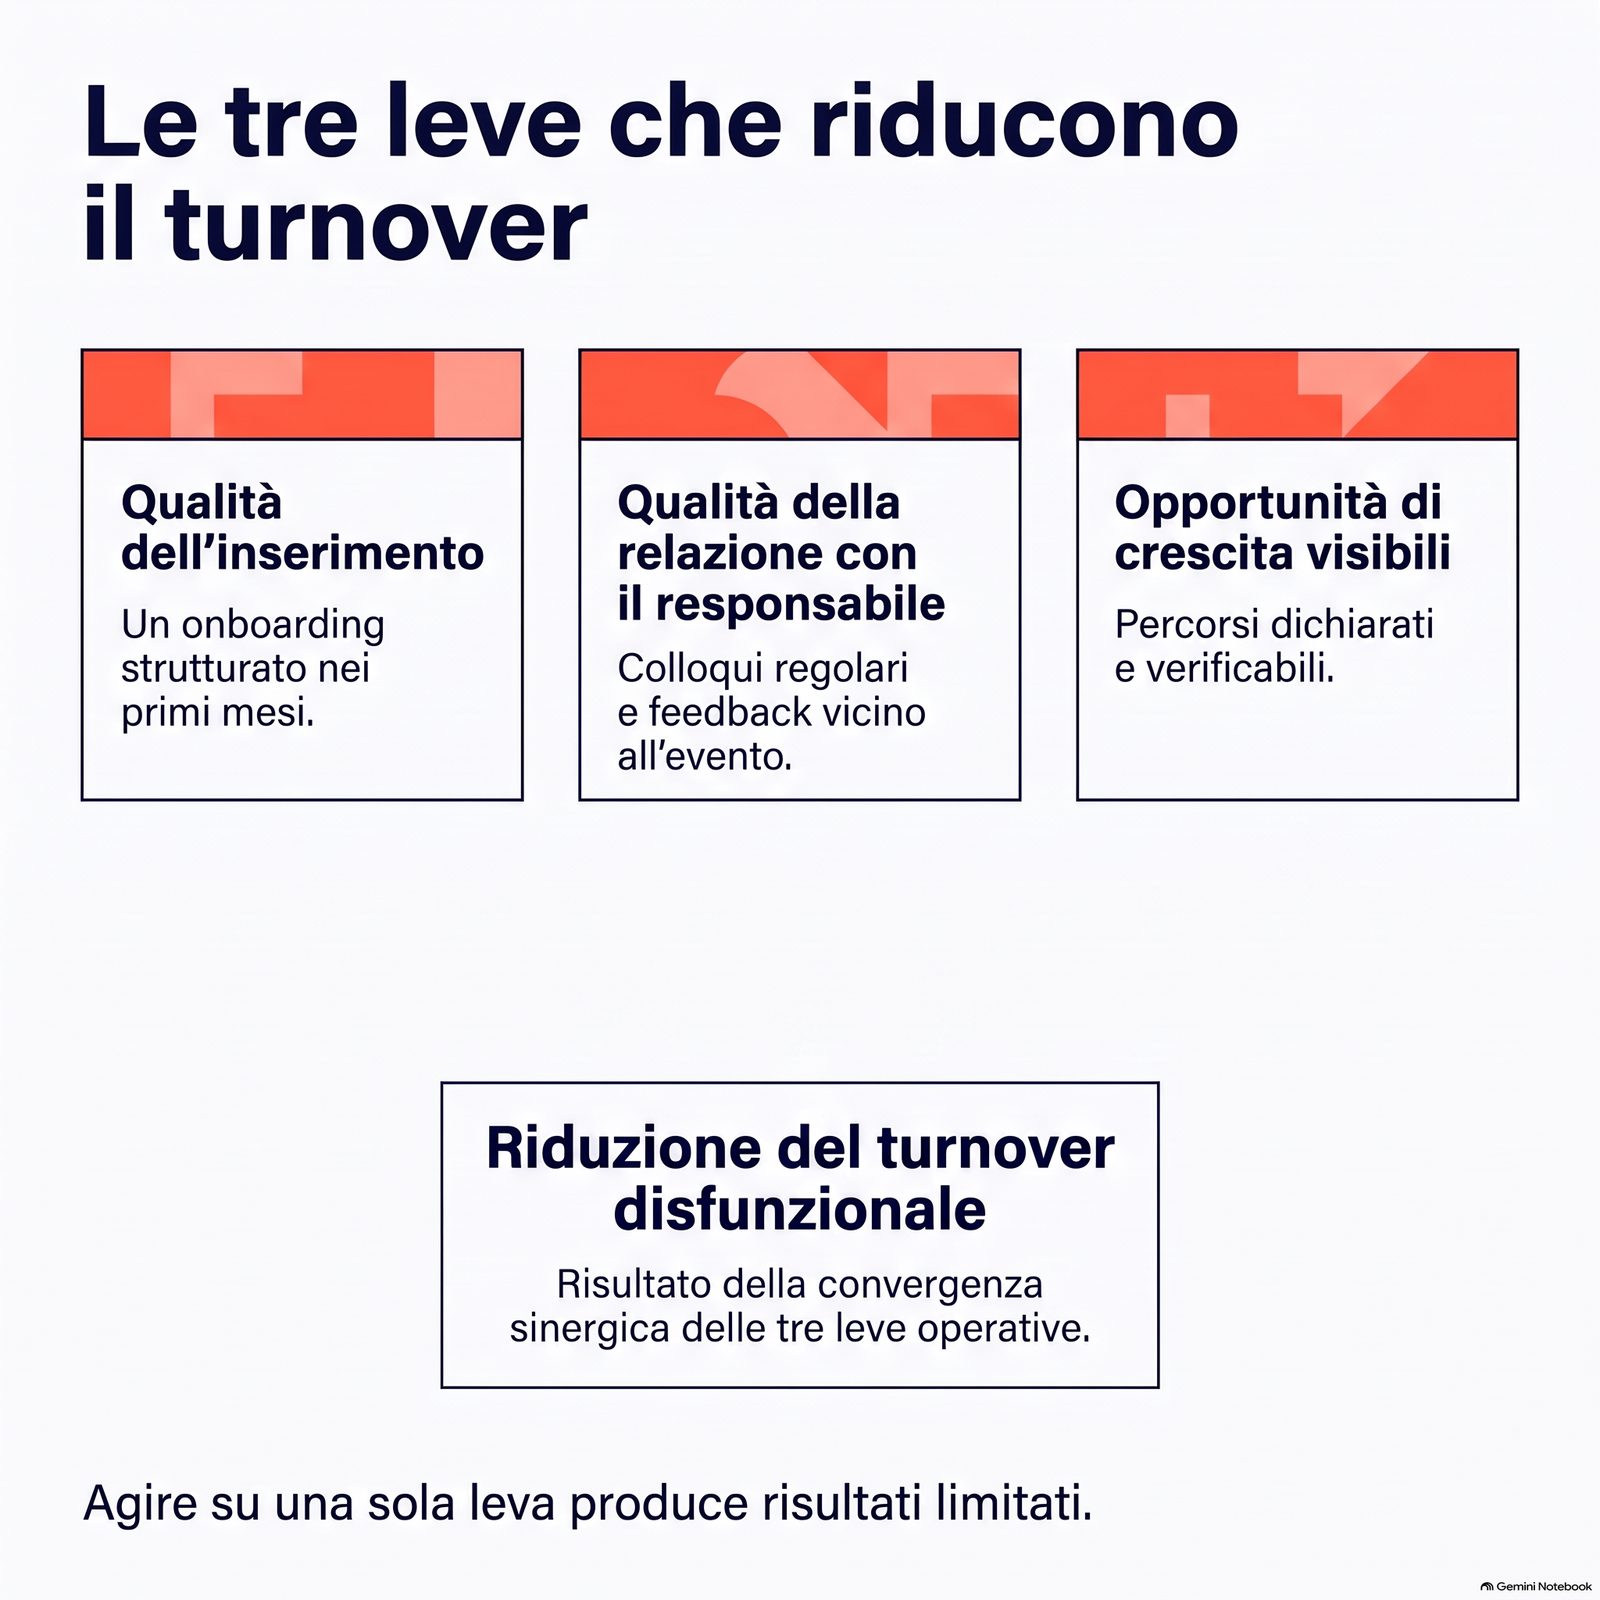
The practical levers for reducing dysfunctional turnover fall into three categories: quality of initial onboarding, quality of the relationship with the direct manager, visible growth opportunities. Acting on only one of these dimensions — typically just pay — produces limited results. An integrated package is more effective than a single lever.
Which lever should you pull first to reduce early turnover? Raising pay when the cause is the relationship with the boss is a fix that doesn't hold beyond six months.
The structure of the three practical levers, with concrete examples.
Quality of initial onboarding. Early turnover (within 12 months) is, in most cases, linked to inadequate onboarding: misaligned expectations, a relationship network that never got started, unwritten codes that were never passed on. Investing in structured onboarding — particularly the 30-60-90 day plan and assigning a buddy — is the lever with the fastest return on early turnover. To go deeper on this dimension, the article on the first 90-day plan for new employees offers the practical framework.
Quality of the relationship with the direct manager. Among the most frequent causes of voluntary resignations in smaller companies is often the quality of the relationship with one's direct manager. This lever works through two tools: frequent feedback and clear objectives. A team member who gets specific feedback and knows what's expected of them is significantly less likely to leave than one who works without these elements. For the technical structure of feedback, the article on how to give feedback to team members goes deeper into the practical side.
Visible growth opportunities. A lack of perceptible growth paths produces departures even when the other dimensions are satisfied. Opportunities don't have to be promotions: changes in responsibility, new projects and developing skills in areas people care about are perceptible signs of growth even in very small companies. The condition is that they're visible — communicated explicitly, not left for people to infer.
Recognizing and correcting common mistakes in managing turnover
The most common mistakes in managing turnover aren't about method, they're about interpretation: treating every departure as a problem, stopping at the stated causes, underestimating the invisible costs, using aggregate indicators without breaking them down, acting on a single lever. Recognizing them is more useful than memorizing them, because they show up in different forms depending on company size. Addressing them takes honesty more than method.
Which mistake costs more: ignoring turnover or reacting to every departure? Both extremes lead to the same outcome — a company that loses the right people without noticing in time.
The five most common mistakes, each with a quick fix.
1. Treating every departure as a problem. This produces disproportionate reactions and investments on normal departures. Fix: apply the key/replaceable × timing matrix before analyzing each departure.
2. Stopping at the causes stated in the exit interview. The stated causes are often sugar-coated versions of the real ones. Fix: complement the exit interview with stay interviews with current team members and pattern analysis by function.
3. Underestimating the invisible costs. Turnover is seen as "expensive but normal" without ever quantifying the real effect. Fix: calculate the full five-item cost at least once for a key person who left recently. The exercise produces a different assessment of the investment in retention.
4. Using aggregate indicators. The overall turnover rate hides the critical patterns. Fix: break it down at least by function and by timing (within/after 12 months).
5. Acting on a single lever. Raising pay, or only improving onboarding, or only clarifying objectives. Fix: assess the three levers in parallel and intervene where the cause analysis points to the main problem.
Limits and conditions of applicability
The turnover analysis described in this article is grounded in the Italian context. The data cited (Italian Ministry of Labor, ISTAT, the Excelsior information system) refer to Italian companies as a whole and can't automatically be transferred to organizations that are very different in sector, size or location.
The five-item cost breakdown is an estimation framework, not measured data: the actual estimate varies significantly depending on the type of role, how formalized the processes are and how much that specific company depends on tacit knowledge. A company with very well-documented processes has significantly lower tacit-knowledge-loss costs than one where processes live in people's heads.
The gap between stated and real causes of turnover, mentioned in this article, remains a useful working hypothesis during analysis, not a figure measured on a representative sample of companies.
FAQ
Is there a "normal" employee turnover rate? There's no universal benchmark, and there's no threshold beyond which the number becomes a problem in itself: rates vary with the sector, the local labor market, company size and the types of contract considered. The comparison that tells you something is the internal one — the same calculation, on the same scope, repeated over the years — and the checks to run before reading it are in the article on calculating the turnover rate. For Italy, the annual report on mandatory employment notifications, which publishes terminated employment relationships by sector of economic activity, offers an external sector reference [1].
How do you handle the sudden departure of a key person? The first 48 hours are critical for the handover and for managing internal communication. After that, the priority is to assess whether the role needs to be filled immediately or redesigned. The departure of a key person is also an opportunity to check whether the role was defined in the best way or had accumulated responsibilities in an unplanned way.
Is turnover always the company's responsibility? No. Some departures are linked to the team member's personal circumstances (a move, a life change, personal projects) that the company couldn't reasonably control. The useful distinction isn't "whose responsibility is it" but "was this departure foreseeable and preventable with reasonable action?".
How do you announce an important departure internally without creating anxiety? Timely, honest internal communication that isn't overly upbeat (avoid "it's a great opportunity for them") is generally more effective than a prolonged silence. A team that receives no information reads the absence as a negative signal, often worse than the reality.
Operational summary
You manage employee turnover by starting from the distinction between normal and dysfunctional turnover with the key/replaceable × timing matrix, going beyond the causes stated in the exit interview with complementary tools (stay interviews, pattern analysis), quantifying the real costs in five items that include tacit knowledge and overload, measuring with indicators broken down by function and timing, and activating the three practical levers in parallel — onboarding, relationship with the manager, growth — rather than just one. The turnover you can read in advance is the turnover you can manage.
Conclusion
Employee turnover isn't a problem in itself; it becomes one when it affects key people, concentrates in certain functions or speeds up without a visible cause. Distinguishing normal from dysfunctional turnover, reading the real causes beyond the stated ones, quantifying the invisible costs too, choosing indicators that guide action, activating integrated practical levers: these are five moves that shift turnover from "it happens" to "it's managed."
The thread that ties these elements together is the difference between suffering departures and reading them. The first is paid for in accumulated costs; the second reduces losses and protects critical skills. To frame the practical levers of initial onboarding, it's worth also reading the first 90-day plan for new employees and, for the broader framework, how to manage your people.
A company that manages its turnover is a company where the right people stay long enough to grow into their roles, critical skills don't walk out with a single exit interview, and departures turn into useful information instead of unrecorded costs. It's a more solid organizational stance and more sustainable long-term growth, open to organizations of any size.
Sources and references
[1] Ministero del Lavoro e delle Politiche Sociali, "Rapporto annuale sulle Comunicazioni Obbligatorie 2025". Available at: https://www.lavoro.gov.it/documenti/rapporto-annuale-sulle-comunicazioni-obbligatorie-2025.pdf
[2] ISTAT, "Censimento permanente delle imprese 2023: primi risultati", Statistiche report. Available at: https://www.istat.it/it/files/2023/11/REPORTCensimprese.pdf
[3] Unioncamere — Ministero del Lavoro, Sistema informativo Excelsior, "La domanda di professioni e di formazione delle imprese italiane nel 2024". Available at: https://excelsior.unioncamere.net/sites/default/files/pubblicazioni/2024/Domanda_professioni_formazione_imprese.pdf