
Business innovation is the introduction, by a company, of products, processes, organizational methods or business models that are significantly new or improved compared with what is already in use, according to the definition adopted by the OECD/Eurostat Oslo Manual [1]. It is not the same as technical invention, and it is not limited to digitalization.
In Italy, over the 2020-2022 period, 58.6% of industrial and service companies with at least 10 employees carried out activities aimed at introducing innovations, with a significant gap by company size [8]. The picture is therefore nuanced: the following sections clarify what really counts as business innovation, what the main types are, how to introduce it in a growing company and which recurring mistakes reduce the return on the investment.
Establish what counts as business innovation before you invest
The Oslo Manual distinguishes four forms of innovation: product, process, organizational and marketing [1]. Companies often label plain technology upgrades as innovation. Drawing the boundary is the first methodological lever: without a shared definition, many investments look "innovative" and become hard to measure.
When can a change in a company be called innovation, and when is it just an upgrade? The difference does not lie in the money spent, but in the discontinuity it creates in the value offered.
An operational definition, derived from the 2018 OECD/Eurostat Oslo Manual [1], requires three conditions for a change to qualify as innovation: (a) it must be significantly new or improved compared with what is already in use in the company; (b) it must be introduced on the market or within the organization, that is, actually applied and not just designed; (c) it must produce observable value, whether economic, organizational or in terms of positioning. The three conditions must be checked together: a project that has been developed but not released is not yet innovation; an activity that has been released but is not significantly different is ordinary updating.
It pays to draw a clear line with respect to three related concepts that everyday language tends to confuse. Innovation and invention are not the same: invention is the creation of a new idea or device, while innovation exists only when the idea is introduced on the market or within an organization and produces value [1]. An unused patent is not innovation. Innovation and digitalization are not the same: digitalization is the conversion of processes and data into digital form, and it becomes process innovation only if it significantly changes the way the company produces or delivers value [3]; adopting management software is not, in itself, innovating. Innovation and continuous improvement are not the same: continuous improvement works through small increments on the existing process, while innovation introduces a change in kind. They are not in opposition, since they coexist and feed each other, but confusing them leads you to overestimate the impact of everyday kaizen actions.
Eurostat data from the CIS (Community Innovation Survey) show significant variation across EU countries: in 2020-2022 the European average of companies with innovation activities was 51.4%, with values ranging from 70.3% in Belgium to much lower shares in other member states [2]. Defining the boundary is not an academic exercise: without a shared definition, the company confuses replacement investments (a new PC, updated software) with innovation investments, and it becomes impossible to assess the return of each category after the fact. Measurement, even before execution, starts from qualifying the boundary correctly.
Once it is clear what counts as innovation, the next step is to understand which type to focus resources on: product, process and business model have very different costs, timelines and indicators.
Map the three operational types: product, process, business model
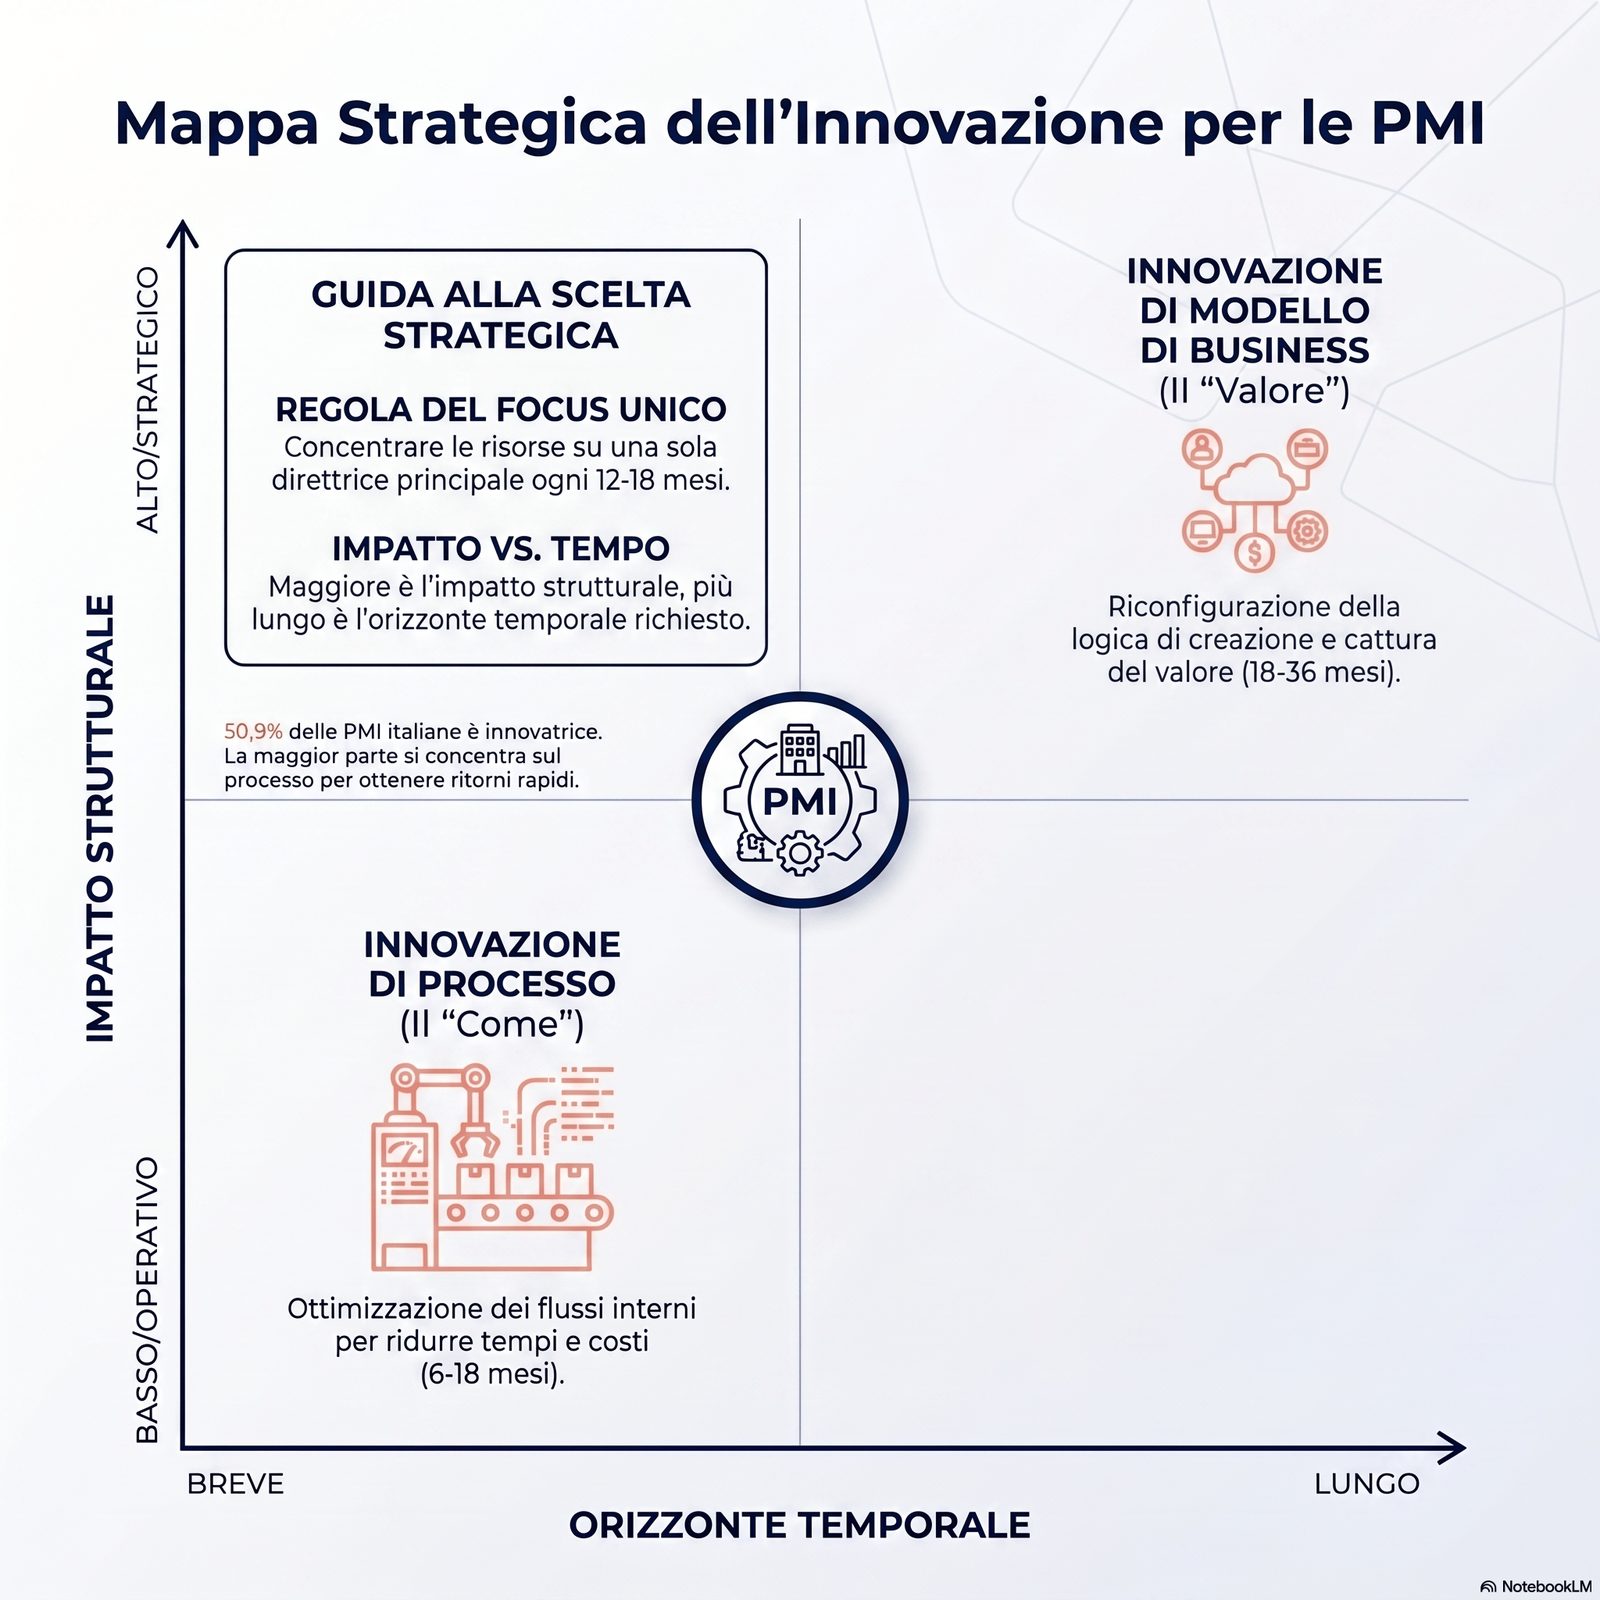
Product, process and business model innovation are not synonyms: they have different costs, timelines and indicators. Confusing them produces inconsistent investment plans. A three-quadrant map lets you choose where to focus resources over the next 12-18 months, without spreading energy across all three directions at once.
Which type of innovation gives a company with 10-50 employees the fastest return on average? ISTAT data show that process innovation is the most common among smaller Italian companies [8], and not by chance.
A comparative map of the three operational types helps you compare them on the parameters that matter for the decision.
| Type | What changes | Typical horizon | Average cost | Outcome indicators |
|---|---|---|---|---|
| Product | Features, functionality, design of the offering | 12-24 months | Medium-high | Share of revenue from new products, time-to-market, customer satisfaction |
| Process | How you produce, deliver, support | 6-18 months | Low-medium | Cycle time, unit cost, quality (defect rate) |
| Business model | Logic of value creation, delivery, capture | 18-36 months | Variable (but high structural risk) | Margins, customer acquisition rate, recurring revenue |
Product innovation is the most visible, but not always the most accessible for a smaller company: it requires investment in research, prototyping and market launch, and it typically has a longer payback horizon. It is the priority direction when your current product shows signs of technological obsolescence, when competitors are introducing variants that make yours harder to defend, or when there is an unserved segment that requires a substantial change to the offering.
Process innovation is the most common among smaller Italian companies according to ISTAT data [8], and the one with the most favorable cost-benefit ratio in the short term. It concerns the way the company produces and delivers what it already sells: redesigning the production flow, automating repetitive steps, reorganizing logistics, digitalizing administrative processes. It does not change the what, it changes the how, with direct effects on costs, quality and lead times.
Business model innovation is the most demanding and the least common. It changes the logic by which the company creates, delivers and captures value: not a new product, not a new process, but a new economic architecture. Examples: moving from one-time sales to a subscription, joining a multi-sided platform, vertical integration or disintermediation. Teece's academic framework [6] frames business model innovation as the reconfiguration of six interdependent elements (value proposition, segments, channels, cost structure, revenue structure, partner ecosystem).
For a company with 10 to 100 employees, a sensible operating rule is to focus resources over the next 12-18 months on a single main direction, possibly supported by smaller initiatives on the others. Trying to innovate product, process and model at the same time creates a dispersion that hits limited organizational capacity cumulatively. Deciding where to focus, however, requires reading the context data, which is the topic of the next section.
Use the data on Italian companies to choose where to innovate first
In Italy, 58.6% of companies with at least 10 employees carried out innovation activities in 2020-2022, but the share falls to 55.8% among companies with 10-49 employees and rises to 84.7% above 250 [8]. Comparing this with the EU average [2] helps calibrate expectations. Knowing your relative position is the prerequisite for not confusing "we are doing a lot" with "we are doing enough compared with the market."
Is an Italian company that innovates "in line with the national average" really safe from European competition? The national average is high, but it covers a wide dispersion: the useful comparison is with the countries that innovate more than Italy, not with the European average.
ISTAT data on innovation in Italian companies (2020-2022 survey, published in November 2024) give a nuanced picture [8]. The share of companies with innovation activities among those with at least 10 employees is 58.6%, but with a marked difference by size: 55.8% in the 10-49 employee class, 74.3% in the 50-249 class, 84.7% above 250. Innovators in the strict sense, those that actually introduced at least one product or process innovation, are 55.7% of the total, with 53.0% among small companies and 81.6% among large ones. Scale therefore systematically affects the propensity to introduce innovations.
The figure is not uniform across types: process innovation is the most widespread (53.0% of companies invest in new or substantially improved processes, compared with 32.8% that innovate their products), and within it the leading areas are production processes and methods (30.5%), information systems (29.8%) and work organization and human resource management (29.7%), while marketing (22.6%) and logistics (15.0%) lag behind [8]. The Bank of Italy's 2023 Invind survey confirms that innovation among smaller Italian companies is concentrated on process and operational digitalization, with lower investment in product R&D than large companies [4].
The European comparison provides a useful calibration, and it runs against conventional wisdom. The Eurostat CIS survey for 2020-2022, covering industrial and service companies with at least 10 employees, puts the EU-27 average at 51.4% of companies with innovation activities and records Italy (63.1%), Germany (63.4%) and Finland (61.5%) above 60%, behind only Belgium (70.3%) and Greece (65.5%) [2]. The figure is not a "report card" on the Italian economy, but an indicator of competitive positioning: out of twenty-seven member states Italy ranks fourth, and the benchmark that matters is not the European average, which it exceeds by almost twelve points, but the three countries ahead of it.
For an individual company, knowing this data is the prerequisite for two operational choices. First choice: which benchmark to measure yourself against. Comparing yourself only with the national average can create a false sense of security if your target market is European. Comparing yourself with sector-and-country benchmarks (Germany for manufacturing, France for advanced services, and so on) gives a more realistic bar. Second choice: where to allocate resources first. For a company with 10 to 49 employees, starting with process innovation, the most common direction with the fastest payback, is a well-documented choice in most cases, before expanding to product and model.
Once you have read your relative position, deciding which concrete projects to fund requires a structured decision-making process. That is the subject of the next section.
Build the decision-making process: from strategic scanning to project selection
Effective innovation does not start from an idea, but from a decision-making process structured in four phases: scanning the context, generating options, evaluation and selection, resource allocation. Skipping the first or the third phase is the most common cause of projects that are launched and then abandoned. Light but explicit governance reduces the mortality rate of innovation projects.
Who actually decides which innovation project gets funded in a growing company? When the answer is "the business owner, by gut feeling," the decision-making system is the first bottleneck.
A structured decision-making process for innovation is organized in four sequential phases, each with a verifiable output.
Phase 1 — Strategic scanning of the context (output: map of pressures and opportunities). You collect the relevant signals in a structured way: moves by direct competitors, technological developments under way in the sector, expected regulatory changes, signs of dissatisfaction or unmet requests from your customers. For a company without a research department, a half-day scan every six months, led by the top decision makers with input from sales and operations managers, is enough. Output: a concise document of 3-5 pages.
Phase 2 — Generating options (output: list of candidate ideas). You deliberately generate 10-20 possible innovation ideas, drawing on the context scan, internal contributions and external sources. Generation must be kept separate from evaluation: censoring ideas while you collect them reduces the variety available. Useful tools: internal workshops with employees at every level, analysis of unmet customer requests, monitoring of published patents and research publications in the sector.
Phase 3 — Evaluation and selection (output: portfolio of 2-4 projects). Candidate ideas are evaluated on a shared matrix that combines expected impact, feasibility (technical, organizational, financial) and operational risk. A workable matrix gives each item a score from 1 to 5 and selects the ideas with the highest cumulative score, while checking that the final combination is balanced in terms of horizon (some short-term ideas, some medium-term). The final selection should identify 2-4 projects for the following 12-18 months: beyond that number, the organization spreads itself thin.
Phase 4 — Resource allocation (output: budget and responsibilities). You assign people, time and budget to the selected projects. An initiative without allocated resources is not a project: it is a statement of intent. For each project you need to identify a manager (a person, not a committee), a working team (even a minimal, part-time one), a budget and an interim checkpoint within 90 days.
Data from ISTAT's permanent census of Italian companies show how thin the decision-making structure is: among companies with innovation activities, only 20.8% have identified an internal unit or person responsible for projects, only 18.3% plan them against a predefined budget and only 10.1% apply the innovation management principles of the UNI EN ISO 56002 standard [9]. Companies that skip phase 1 (scanning) tend to fund projects that respond to short-term urgencies rather than structural opportunities; those that skip phase 3 (explicit evaluation) tend to fund projects chosen for their affinity with the main decision maker, not for their expected impact. Both mistakes systematically reduce the return on innovation investments.
On the organizational change that accompanies the introduction of the selected projects, it is also worth reading the guide to managing organizational change. Once the decision-making process is defined, the next step is to look in detail at the most common type in smaller companies: process innovation.
Introduce process innovation: the most common case in companies
Process innovation is the most accessible for small and midsize companies and the one with the most favorable cost-benefit ratio in the short term [8]. It unfolds in three concrete steps: mapping the current state, identifying bottlenecks, redesigning with new technologies or procedures. The common risk is to reduce it to "buying software": process innovation is organizational first, technological second.
Why do so many automation projects stall after the first six months? Often the software was installed on top of a process that had not yet been mapped.
The three steps of process innovation, in strictly sequential order.
Step 1 — Mapping the current state (as-is). You describe the process as it works today, not as it should work. You identify the people involved, the sequence of activities, discretionary decisions, information exchanges, outputs produced and the average time of each phase. Mapping must be done with the people who carry out the process, not by whoever designs it on paper: the "official" version and the "real" version rarely match. On the specific topic of building a process map, it is also worth reading process mapping: what it is and when you need it.
Step 2 — Identifying bottlenecks. Once the process is visualized, you identify the phases that limit overall capacity: where queues build up, where lead times stretch, where errors concentrate, where people lose hours in coordination. The bottleneck is not always the most visible point: in many smaller Italian companies, the real bottleneck is the decision waiting for the business owner's approval, not the operational step downstream. The ISTAT survey on businesses and ICT [3] reports that a significant share of smaller Italian companies shows centralized decision-making processes that create organizational bottlenecks.
Step 3 — Redesign (to-be) with new technologies or procedures. The redesign starts from the bottleneck identified and introduces a targeted change: a new procedure, an enabling technology, a redistribution of responsibilities, a change in sequence. Technology comes in only at this point, and only if it is relevant to the bottleneck identified. Implementing job management software without first mapping the approval flows is a common cause of projects that stall after six months: the software amplifies the inefficiencies of the underlying process instead of solving them.
On the specific topic of automation, the most documented risk is confusing automation with innovation: automating a process that has not been mapped means locking in its inefficiencies at an additional cost. The right sequence is map first, then simplify, then automate. To go deeper, business process automation: a practical guide develops the topic.
Successful process innovation produces measurable effects in 6-12 months: shorter cycle time, lower unit cost, lower error rate. ISTAT surveys on businesses and ICT [3] confirm the correlation between the adoption of digital technologies and improvements in efficiency indicators, but with significant variability that depends on the quality of the upstream organizational process. Beneath the process level lies the cross-cutting dimension of digital transformation, the topic of the next section.
Manage digital transformation as a cross-cutting lever, not a substitute
Digital transformation is an enabling lever that runs across product, process and business model; it is not a fourth type of innovation, but a technical condition that multiplies its impact. Treating it as a separate IT project is the most expensive mistake: digital transformation creates value only if it is anchored in real work processes and in people's skills.
Can a company call itself "digitally transformed" if it has cloud, ERP and CRM but has not changed how it works? ISTAT surveys on digital intensity indicate that in 2024, 70.2% of Italian companies with 10-249 employees reached at least the basic level of the indicator (four digital activities out of twelve), while only just over a quarter (26.2%) reached at least a high level [5].
Digital transformation should be broken down into three levels, each of which produces a qualitatively different value.
Level 1 — Digitalization (data and processes in digital form). You convert what used to be on paper into digital form: electronic invoicing, document archives, management software for orders and inventory. It is the basic level, now widespread even among smaller Italian companies according to ISTAT data on businesses and ICT [3]. The value produced is ordinary efficiency: less paper, less time spent searching, fewer transcription errors.
Level 2 — Digital optimization (processes redesigned around new technological possibilities). You change processes by taking advantage of what digital makes possible: automated workflows, integration between systems, decisions based on data collected in real time. This is the level at which digitalization becomes process innovation. It is also the level at which the size gap is most visible: ISTAT's digital intensity indicator places 26.2% of Italian companies with 10-249 employees at least at a high level, compared with 83.1% of those with at least 250 employees [5].
Level 3 — Digital transformation (a change in the business model enabled by digital). You change the logic of value creation: new digital services, subscription models, platforms that connect previously separate players, the ability to sell products as services. This is the level that intersects the business model innovation described by Teece [6] and Chesbrough's open innovation logic [7].
The most expensive mistake, recurring in field experience, is treating digital transformation as a separate IT project: you buy software, hire an external vendor to implement it and wait for the benefits. The benefits do not arrive because the software has been layered on top of existing processes and skills without adapting them. Digital transformation creates value only if it is anchored in real work processes and in people's skills, that is, if it tackles the organizational dimension at the same time.
ISTAT data on businesses and ICT [3] confirm that adopting technologies (ERP, CRM, cloud) does not automatically translate into productivity gains: the differentiating factor is process redesign and the development of internal digital skills. A company with cloud, ERP and CRM but unchanged processes and skills remains at level 1 of digitalization, even if the technology vendor's invoice suggests otherwise.
For companies that want to move beyond level 1, the operational path combines three actions: (a) mapping processes before the technology investment; (b) developing internal digital skills through structured training, not just vendor training; (c) progressively integrating systems, avoiding separate digital islands.
For the complete practical guide to the three levels of digital maturity, it is also worth reading digital transformation in smaller companies: levels, levers and mistakes to avoid.
With digital transformation addressed as a cross-cutting lever, it remains to see when product or process innovation is no longer enough: the case of the business model.
Innovate the business model: when product and process are not enough
When your reference market becomes saturated or changes structure, acting only on product or process is not enough: you need to redesign how the company creates, delivers and captures value [6]. Business model innovation is the most demanding, but it has the greatest leverage when the competitive context changes profoundly.
When does a change in pricing or distribution channel become business model innovation rather than a simple commercial move? The deciding factor is whether the logic of value changes, not a single parameter.
Teece's academic framework [6] describes the business model as the integrated set of choices on six elements: value proposition, customer segments, access channels, cost structure, revenue structure, partner ecosystem. You can speak of business model innovation when the change affects at least two elements in a coordinated way and produces a new logic of value creation. Changing a single price is a commercial action; changing price, revenue recurrence and target segment is the beginning of business model innovation.
Five recurring patterns of business model innovation documented in the literature [6][7].
1. From one-time to recurring. The product sold in a single transaction becomes a subscription service. The revenue structure changes, the relationship with the customer changes, and the unit of sale often changes too.
2. From product to platform. The company stops being a single producer and becomes an intermediary between producers and customers, monetizing access or transactions. The cost structure and the partner ecosystem change profoundly.
3. From closed to open (open innovation). The company opens its innovation process to external contributions (customers, suppliers, academic research, developer communities) according to the logic described by Chesbrough [7]. The partner ecosystem changes and, often, so does the R&D cost structure.
4. From generalist to vertical. The company focuses its offering on a narrow segment, developing a deeply specialized value proposition. The target segment changes and, as a result, so do channels and cost structure.
5. From sales to outcome. The customer no longer pays for the product or service, but for the result it produces (output-based pricing, performance-based contracts). The revenue structure changes and risk is redistributed between supplier and customer.
For a growing company, business model innovation is the most demanding direction: it requires an in-depth preliminary strategic analysis, the ability to manage the transition while the current model keeps generating the revenue it needs, and patient capital. Documented cases of business model innovation in Italian companies show both successes and failures; when it works, the reconfiguration produces a competitive advantage that is hard for competitors who stay with the traditional model to replicate.
The signal that it is time to move from product-process innovation to business model innovation is diminishing returns: further product or process improvements produce decreasing returns, while the market shows signs of structural change (new entrants with different logics, changing customer behavior, substitutes that change the consumption category). Under these signals, incremental innovation is no longer enough. Above any type of innovation, however, there is a cross-cutting dimension that determines the outcome: the organization and the people who make it possible.
Align people, skills and culture: the organizational dimension
Innovation is an organizational act before it is a technological one: it depends on skills, roles, incentives and internal culture [9]. In a company with lean structures, the quality of relationships and the ability to delegate operational decisions weigh more than investments in technology. Without organizational alignment, even technically sound projects are eroded by internal resistance.
How much of the outcome of an innovation project depends on technology and how much on people? Data on Italian companies [9] show that formalizing innovation projects in the organization (a project manager, a budget, a method) remains the exception, not the rule.
Four organizational elements systematically affect the outcome of innovation projects, in light of data from ISTAT's permanent census of Italian companies [9] and the Bank of Italy's Invind surveys [4].
1. Skills. The skills an innovation project requires rarely match those available in the company. The gap must be tackled with three combined levers: internal training on transferable skills, targeted hiring of external profiles with specific experience, and partnerships with suppliers or research centers for highly specialized skills. The common mistake is to tackle the gap with only one of the three levers: training alone (slow), new hires alone (risk of cultural rejection), outsourcing alone (loss of internal learning).
2. Roles and responsibilities. An innovation project needs a sponsor (who protects it from day-to-day operational pressure), an owner (who leads its content) and a team (who carries it out). In many Italian companies, sponsor and owner often coincide with the business owner, creating a decision-making bottleneck: every step forward waits for their attention. Making the three roles explicit and assigning them to different people, where possible, is the minimum form of the internal accountability for innovation projects that today only one innovating Italian company in five says it has assigned [9].
3. Incentives. The people who take part in an innovation project do so on top of their ordinary responsibilities, except in rare cases of full-time assignment. Without explicit recognition (even if only symbolic, even if only in terms of reserved time and protection from operational pressure), participation erodes. Incentives do not have to be financial: internal visibility, learning opportunities and a lighter load of other responsibilities are documented levers.
4. Culture. A company's culture toward innovation is measured in behaviors, not statements: how does the organization react to a failed experiment? Does it treat it as learning (enabling culture) or penalize it as an error (inhibiting culture)? A culture that penalizes failure systematically reduces people's willingness to propose ideas. Changing culture is a multi-year journey, but it can start from concrete practices: making a ritual of sharing lessons from closed projects, distinguishing process errors from outcome errors, openly stating how much experimentation is allowed.
On the specific topic of the organizational practices that support innovation, it is also worth reading continuous improvement in the company: the link between a culture of improvement and the ability to innovate in a discontinuous way rests on the same organizational infrastructure described by the data cited [9]. With product, process, model and the organizational dimension covered, one final question remains: how do you measure whether innovation is working?
Measure the return and impact of innovation (beyond revenue)
Measuring innovation only by revenue is misleading: the effects mature over different horizons (12-36 months) and are spread across operational efficiency, positioning and the ability to acquire customers. A three-level dashboard (input, meaning spending; output, meaning the number of projects released; outcome, meaning economic and organizational impact) lets you assess the innovation portfolio without squeezing it into the short term.
When can you say that an innovation project "worked"? The answer depends on the level of measurement you adopt, and on when you decide to read it.
A measurement dashboard consistent with the definitions of the Oslo Manual [1] and with the Eurostat CIS surveys [2] is organized on three levels.
Input level (spending on innovation). It measures how much the company invests: R&D spending, person-hours dedicated to innovation projects, the cost of training in new skills, the cost of external consulting and partnerships. These are effort indicators, not result indicators, useful for checking consistency between strategic statements and the actual allocation of resources. A company that declares innovation a priority but allocates 0.5% of revenue to it is signaling a gap between words and deeds.
Output level (what the company produces in terms of innovation). It measures what comes out of projects: the number of new products or services released, the number of processes redesigned and implemented, the number of patents filed, the time-to-market of new releases, the completion rate of projects started. These are indicators of innovation productivity, useful for year-on-year comparisons and for comparing projects with each other.
Outcome level (economic and organizational effect). It measures the impact on business results: the share of revenue from new products, the reduction in process unit cost, improved margins, improved customer satisfaction, a shorter overall time-to-market. These are result indicators: the most relevant, but also the ones that mature with the longest lags (12-36 months depending on the type of innovation).
A fourth level, measured less often but relevant, is learning indicators: the ability to complete projects on schedule, a lower abandonment rate, the quality of skills developed internally, the ability to launch subsequent projects faster than the first. These are indicators of organizational maturity with respect to innovation, and they anticipate medium-term results.
For a company with 10 to 100 employees, a compact dashboard of 6-10 indicators spread across the three levels is enough. Dashboards with thirty indicators often signal that no upstream choice was made about the definition of success. The Eurostat CIS survey [2] uses indicators that are comparable across countries, and a company that adopts indicators consistent with the CIS framework also gains a useful external benchmark.
Measuring well is not enough: measurement remains misleading if you do not recognize the most common mistakes that affect companies' innovation projects.
Common mistakes in business innovation
The mistakes that derail companies' innovation projects are recurrent and predictable: confusing digitalization with innovation, starting from technology instead of the problem, underestimating the organizational dimension, not structuring a decision-making process, measuring only revenue. Recognizing them is the precondition for avoiding them.
What is the most widespread mistake that causes innovation projects to fail? It is not a lack of ideas, but the absence of a process that turns ideas into allocation decisions.
Six error patterns recur in a documented way in data on Italian companies from the Bank of Italy [4] and ISTAT's permanent census of companies [9].
1. Confusing digitalization and innovation. The adoption of management software or an office automation tool is labeled an "innovation project." These are useful activities, but they are replacement, not innovation. Correction: apply the three conditions of the Oslo Manual (significance, actual introduction, observable value) before qualifying a project.
2. Starting from technology instead of the problem. You buy a technology available on the market and look for a problem to solve after the fact. The software arrives before the process is mapped, the IoT device before the use case is defined. Correction: the problem comes before the solution; technology comes in only when the problem is documented.
3. Underestimating the organizational dimension. The technical project is funded, but training, the redefinition of roles and the management of internal resistance are neglected. The technical project succeeds but is not absorbed by the organization. Correction: every innovation project has a matching organizational change management plan, sized to the expected impact. The topic is covered in more depth in managing organizational change.
4. Not structuring the decision-making process. Decisions about which projects to fund are made by affinity with the main decision maker, not by expected impact. The projects chosen are not the best ones, they are the ones most visible to whoever decides. Correction: introduce the scanning-generation-evaluation-allocation sequence described in the section "Build the decision-making process."
5. Measuring only revenue. A project's outcome is assessed only on revenue in the months after release, ignoring output indicators (what was actually released), learning indicators (capabilities developed) and non-financial outcomes (positioning, customer satisfaction). Correction: a three-level dashboard (input, output, outcome) with a time horizon consistent with the type of innovation.
6. Spreading resources across too many directions at once. Initiatives on product, process, model and digital transformation are launched in parallel without focusing resources on one main direction. No initiative reaches critical mass, and all of them progress slowly. Correction: over the next 12-18 months, focus resources on one main direction, possibly supported by smaller initiatives on the others.
The six mistakes share a common root: the absence of a structured decision-making process that turns ideas into consistent allocation choices. The distance between "we have lots of ideas" and "we have a portfolio of funded projects with clear responsibilities" is the real dividing line between managed innovation and random innovation.
Limits and conditions of applicability
The practical guidance in this article refers mainly to manufacturing and service companies in Italy with between 10 and 100 employees. For micro-businesses and independent professionals, the mechanisms need to be simplified: a single innovation direction and a lean decision-making process are enough. For organizations with more than 250 employees, it is advisable to introduce more elaborate roles and processes than those described here, closer to the models observed in large companies.
The statistical data cited (ISTAT [3][5][8][9], Bank of Italy [4], Eurostat CIS [2]) refer to specific samples and periods. They represent documented trends, not universal laws: the associations observed (for example between structured decision-making processes and project completion rates) should not be read as deterministic cause-and-effect relationships.
Teece's framework [6] on business model innovation and Chesbrough's [7] on open innovation were developed and validated mainly on large companies and industrial contexts. Applying them to smaller companies requires adaptation: the mechanisms described remain valid in principle, but scale, available resources and relational dynamics in smaller companies introduce specific constraints.
The indicative timelines (6-18 months for process innovation, 12-24 for product, 18-36 for business model) are not averages measured by a statistical source, and none of the sources cited in this article contains them: they are an operating criterion of the editorial team, an order of magnitude for sizing expectations before starting a project. Individual companies may deviate depending on sector, technological complexity and the quality of the upstream organizational process. The share of revenue from new products, a widely used outcome indicator, depends heavily on the sector: comparisons across different sectors are misleading.
Finally, innovation carries structural risk: a significant share of the projects started do not reach the expected outcome. Reducing systematic risk through a structured decision-making process does not mean eliminating it.
FAQ
1. What is the difference between innovation and digitalization? Digitalization is the conversion of processes and data into digital form. It becomes process innovation only when it significantly changes the way the company produces or delivers value [1][3]. Adopting management software is digitalization; redesigning a workflow by taking advantage of what digital makes possible is process innovation.
2. Which type of innovation should a growing company focus on first? ISTAT [8] and Bank of Italy [4] data show that process innovation is the most common among smaller Italian companies and has the most favorable cost-benefit ratio in the short term. Focusing resources on this direction in the first 12-18 months is a well-documented choice, before moving on to product and model.
3. How long does it take for an innovation project to produce results? It depends on the type: 6-18 months for process innovation, 12-24 months for product innovation, 18-36 months for business model innovation. Measuring the outcome before these horizons risks confusing an absence of results with an absence of impact.
4. Does a company need a dedicated R&D department to innovate? No. ISTAT data [9] show that Italian companies also innovate without a formal R&D department, through structured decision-making processes, partnerships with suppliers and research centers, and targeted internal training. Formal structure matters less than process discipline.
5. How do you measure the return on an innovation project? A three-level dashboard (input: spending, person-hours; output: releases, patents, time-to-market; outcome: share of revenue from new products, cost reduction, margins) plus learning indicators (completion rate, capabilities developed). Measuring only revenue is misleading because it ignores the effects on efficiency and positioning.
6. Is artificial intelligence within reach of a company without in-house IT skills?
Artificial intelligence is within reach even of a company without structured in-house IT skills, provided it starts from narrowly defined use cases and not from a project that spans the whole organization.
ISTAT data on businesses and ICT show that adoption of artificial intelligence tools is still limited among smaller Italian companies compared with larger ones [3], while field experience indicates that the most solid adoptions start from a single, well-defined process, not from a general AI transformation plan.
A narrowly defined use case (drafting standard replies for customer service, a first screening of job applications, support in writing recurring documents) lets you verify the value produced without requiring software development skills.
The most important organizational lever is therefore not in-house technical expertise, but the ability to choose a specific problem on which to measure a result quickly.
For a closer look at use cases and adoption criteria, artificial intelligence in the company: a guide develops the topic.
7. Where should you start digital transformation if the company uses only basic tools?
If you are starting from basic digital tools (email, minimal management software, little else), you should avoid the most common mistake: buying new tools before understanding which processes actually need to change.
The most effective sequence reverses the instinctive order: first you map the processes that generate the most value or the most inefficiency, then you identify the data you would need to manage them better, and only at the end do you choose the technology tool consistent with the processes and data already defined.
ISTAT surveys show that among Italian companies with 10-249 employees, 70.2% reach at least the basic level of digital intensity, but only 26.2% reach at least a high level [5]: adopting the tool, on its own, is not the same as redesigning the underlying process.
Starting from a single critical process, digitalizing it methodically and measuring its effect before widening the scope reduces the risk of investments that do not really change the way the company works.
Practical summary
Business innovation is the introduction of products, processes, organizational methods or business models that are significantly new or improved, according to the Oslo Manual definition [1]. It must be distinguished from invention, digitalization and continuous improvement: confusing them leads to ineffective investments and measurement difficulties. The three operational types (product, process, business model) have different costs, timelines and indicators: for a growing company, process innovation is the most accessible direction with the fastest payback, to be tackled before the other two. Deciding which projects to fund requires a four-phase structured process (scanning, generation, evaluation, allocation) that demonstrably reduces the abandonment rate. Digital transformation should be treated as a cross-cutting lever, broken down into three levels (digitalization, optimization, transformation): not getting past the basic level is the most common case among smaller Italian companies, where according to ISTAT only 26.2% reach at least a high level of digital intensity [5]. The organizational dimension (skills, roles, incentives, culture) remains the most neglected: a project manager, a dedicated budget and a management method apply to only a minority of innovating Italian companies [9]. Consistent measurement combines input, output and outcome over time horizons consistent with the type of innovation (6-36 months). The recurring mistakes (confusing digitalization with innovation, starting from technology, underestimating the organization, deciding by affinity, measuring only revenue, spreading resources too thin) share the root of an inadequate decision-making process. Managed innovation does not guarantee results, but it reduces systematic risk.
Conclusion
Innovating in a company means introducing a measurable discontinuity in product, process or business model, not a technology upgrade. The distinction is methodological and has concrete consequences: if you do not separate innovation, digitalization and continuous improvement, you end up investing in all three without getting clear results in any of them.
The direction is clear: a company that decides where to innovate, how to involve people and skills and how to measure outcomes reduces the mortality rate of its projects and builds competitive advantage over the medium term. To explore the related operational levers, we recommend reading Process mapping: what it is and when you need it, which clarifies the starting point of any process innovation, and Managing organizational change, which helps you understand how to introduce innovation without triggering internal resistance.
Italian companies are not behind the European average in their propensity to innovate [2]: the room for improvement lies in formalization (a project manager, a dedicated budget, an evaluation method), which today applies to fewer than one innovating company in five [9]. It is a cumulative effect that individual business owners can set in motion by starting with the choice of a single, well-governed direction.
Sources and references
[1] OECD/Eurostat, "Oslo Manual 2018 — Guidelines for Collecting, Reporting and Using Data on Innovation", 4th edition, OECD Publishing, 2018. Available at: https://www.oecd.org/en/publications/oslo-manual-2018_9789264304604-en.html
[2] Eurostat, "Community Innovation Survey 2022 — key indicators", Statistics Explained, 2024. Available at: https://ec.europa.eu/eurostat/statistics-explained/index.php?title=Community_Innovation_Survey_2022_-_key_indicators
[3] ISTAT, "Imprese e ICT", Italian National Institute of Statistics. Available at: https://www.istat.it/tag/imprese-e-ict/
[4] Bank of Italy, "Indagine sulle imprese industriali e dei servizi", Bank of Italy — Statistics. Available at: https://www.bancaditalia.it/pubblicazioni/indagine-imprese/
[5] ISTAT, "Imprese e Ict — Anno 2024", press release, January 17, 2025 (Digital Intensity Index and adoption of digital technologies by employee size class). Available at: https://www.istat.it/comunicato-stampa/imprese-e-ict-anno-2024/
[6] Teece D. J., "Business Models, Business Strategy and Innovation", Long Range Planning, vol. 43, 2010, pp. 172-194. Available at: https://doi.org/10.1016/j.lrp.2009.07.003
[7] Chesbrough H., "The Era of Open Innovation", MIT Sloan Management Review, vol. 44(3), 2003. Available at: https://sloanreview.mit.edu/article/the-era-of-open-innovation/
[8] ISTAT, "L'innovazione nelle imprese — Anni 2020-2022", Statistiche Report, November 21, 2024. Available at: https://www.istat.it/wp-content/uploads/2024/11/REPORT_INNOVAZIONE-IMPRESE_2020_2022-REV-21_11.pdf
[9] ISTAT, "Censimento permanente delle imprese 2023 — primi risultati", Italian National Institute of Statistics, November 2023. Available at: https://www.istat.it/it/files/2023/11/REPORTCensimprese.pdf