
Neither option is wrong in the abstract: what makes the difference is knowing, before you decide, who has that skill and at what level.
A professional with two team members, a fifteen-person company split between office and shop floor, a hundred-employee business running several lines: the question comes up when someone leaves or when an order calls for something that was never needed before.
A skills matrix is the grid that crosses the skills the business needs with its people, and assigns a level to every intersection.
Among Italian companies that considered hiring in 2021-2022, 43.7% of small firms reported difficulty finding staff with the technical skills they needed [3].
A skills matrix does not measure how much a person is worth: it shows how many people each skill rests on, and turns that visibility into a decision with a name and a date.
This article shows how to fill in the grid, how to read it, how often to update it and which decisions follow from it.
Who shadows whom: what a skills matrix is
Who do you pair a new hire with for on-the-job training: the most experienced person or whoever happens to be least busy at that moment?
The answer changes from week to week and in both cases it is never written down anywhere — while the Bank of Italy's Invind survey measures Italian companies on a closely related scale: one that separates those who assign roles and promotions based on ability from those who assign them based on seniority or family ties [4].
In almost every business the question "who knows how to do this?" already has an answer, but it lives in the heads of two or three people and changes depending on whom you ask.
As long as the department is small, memory is enough; it stops being enough the day the person you used to ask is gone, or the day you have to decide who gets the few hours of training available.
The skills matrix is the document that takes that memory out of people's heads.
This section defines the tool, distinguishes it from the documents that resemble it and explains why a grid gives the same answer regardless of who happens to be at work that day.
That scale is measured on roughly 3,200 Italian manufacturing and service companies with at least 20 employees, 2019 wave.
The skill the grid records is what a person can do through acquired experience, not the role they hold or the title they have: the short definition is in the glossary.
One third of Italian companies with at least ten employees reported that in 2020 some of their staff did not have the skills needed for the work they did [2].
The job description is prescriptive and says what the role should do; the matrix is descriptive and records what the person can do.
The organizational chart describes who reports to whom, and two people at the same level can have opposite matrices.
A performance review measures how a person worked over a period; the matrix measures what they can do today.
The training plan, on the other hand, is the sequence of actions that comes out of the grid: two documents, not one.
Without a department, the people in the grid are the recurring collaborators and suppliers that part of the work depends on, and the question "if this person isn't here, who does it?" carries the same weight.
With the grid in front of you, the person who does the shadowing is the one who handles the task at a level high enough to teach it, once you have decided what goes into the grid.
Which skills, which people, which levels: the three choices behind the grid
A grid with sixty skills and one with twelve: which one will be reopened six months from now?
The second one, and the reason is not laziness on the part of whoever maintains it: a skill that leads to no different decision is a row that just takes up space.
The three choices that make a matrix usable are made before you write the first name.
The first is which skills go in: not every skill that exists in the company, but those whose absence would stop or slow down a delivery.
The second is who goes in: the natural scope is the department or area, not the whole company, because a grid without a single manager has no one to update it either.
The third is the level scale, which must be short and anchored to a verifiable question, not to an adjective.
This section walks through the three choices with the cut-off criterion for each.
Among Italian companies with at least ten employees, the skills that need improving include technical and operational skills (32.0%), teamwork (31.2%) and professional IT skills (26.1%) [2].
In the grid they become programming a machine tool, reading a technical drawing, preparing quotes, handling a complaint, using the management software.
The grid in the Skills matrix by level — template stops at sixteen skills: this is not a documented rule, it is the point beyond which filling it in takes longer than the decision itself.
On the third choice, the work is not in the four level names, which are in the table, but in the verification question: what must be able to happen for that level to be true, not how good the person holding it is.
The independent level is true when the person performs the task without anyone checking the work afterward.
The expert level is true when the person performs it and can teach it to someone else, and it is the precondition for internal shadowing.
| Choice | The cut-off criterion | The sign that the cut was wrong |
|---|---|---|
| Which skills go in | Losing the skill stops or slows down a delivery | Some columns are never looked at again after the first round |
| Which people go in | The scope has a single manager who sees the finished work | The grid stays half filled in |
| Which levels are used | Each level — none, basic, independent, expert — has a verification question tied to real work | Two managers assign different levels to the same person |
With twelve or sixteen skills chosen this way the grid gets reopened, and what remains is learning how to read it once it is full.
Gap, concentration, coverage, redundancy: how to read the completed grid
A skill covered by one person at expert level, and the same skill covered by two people at independent level: which of the two situations holds up better to a three-week absence?
The second, and it is not a paradox: the value of the grid does not lie in the highest level it contains, but in the number of people above the threshold beyond which the work no longer needs to be checked.
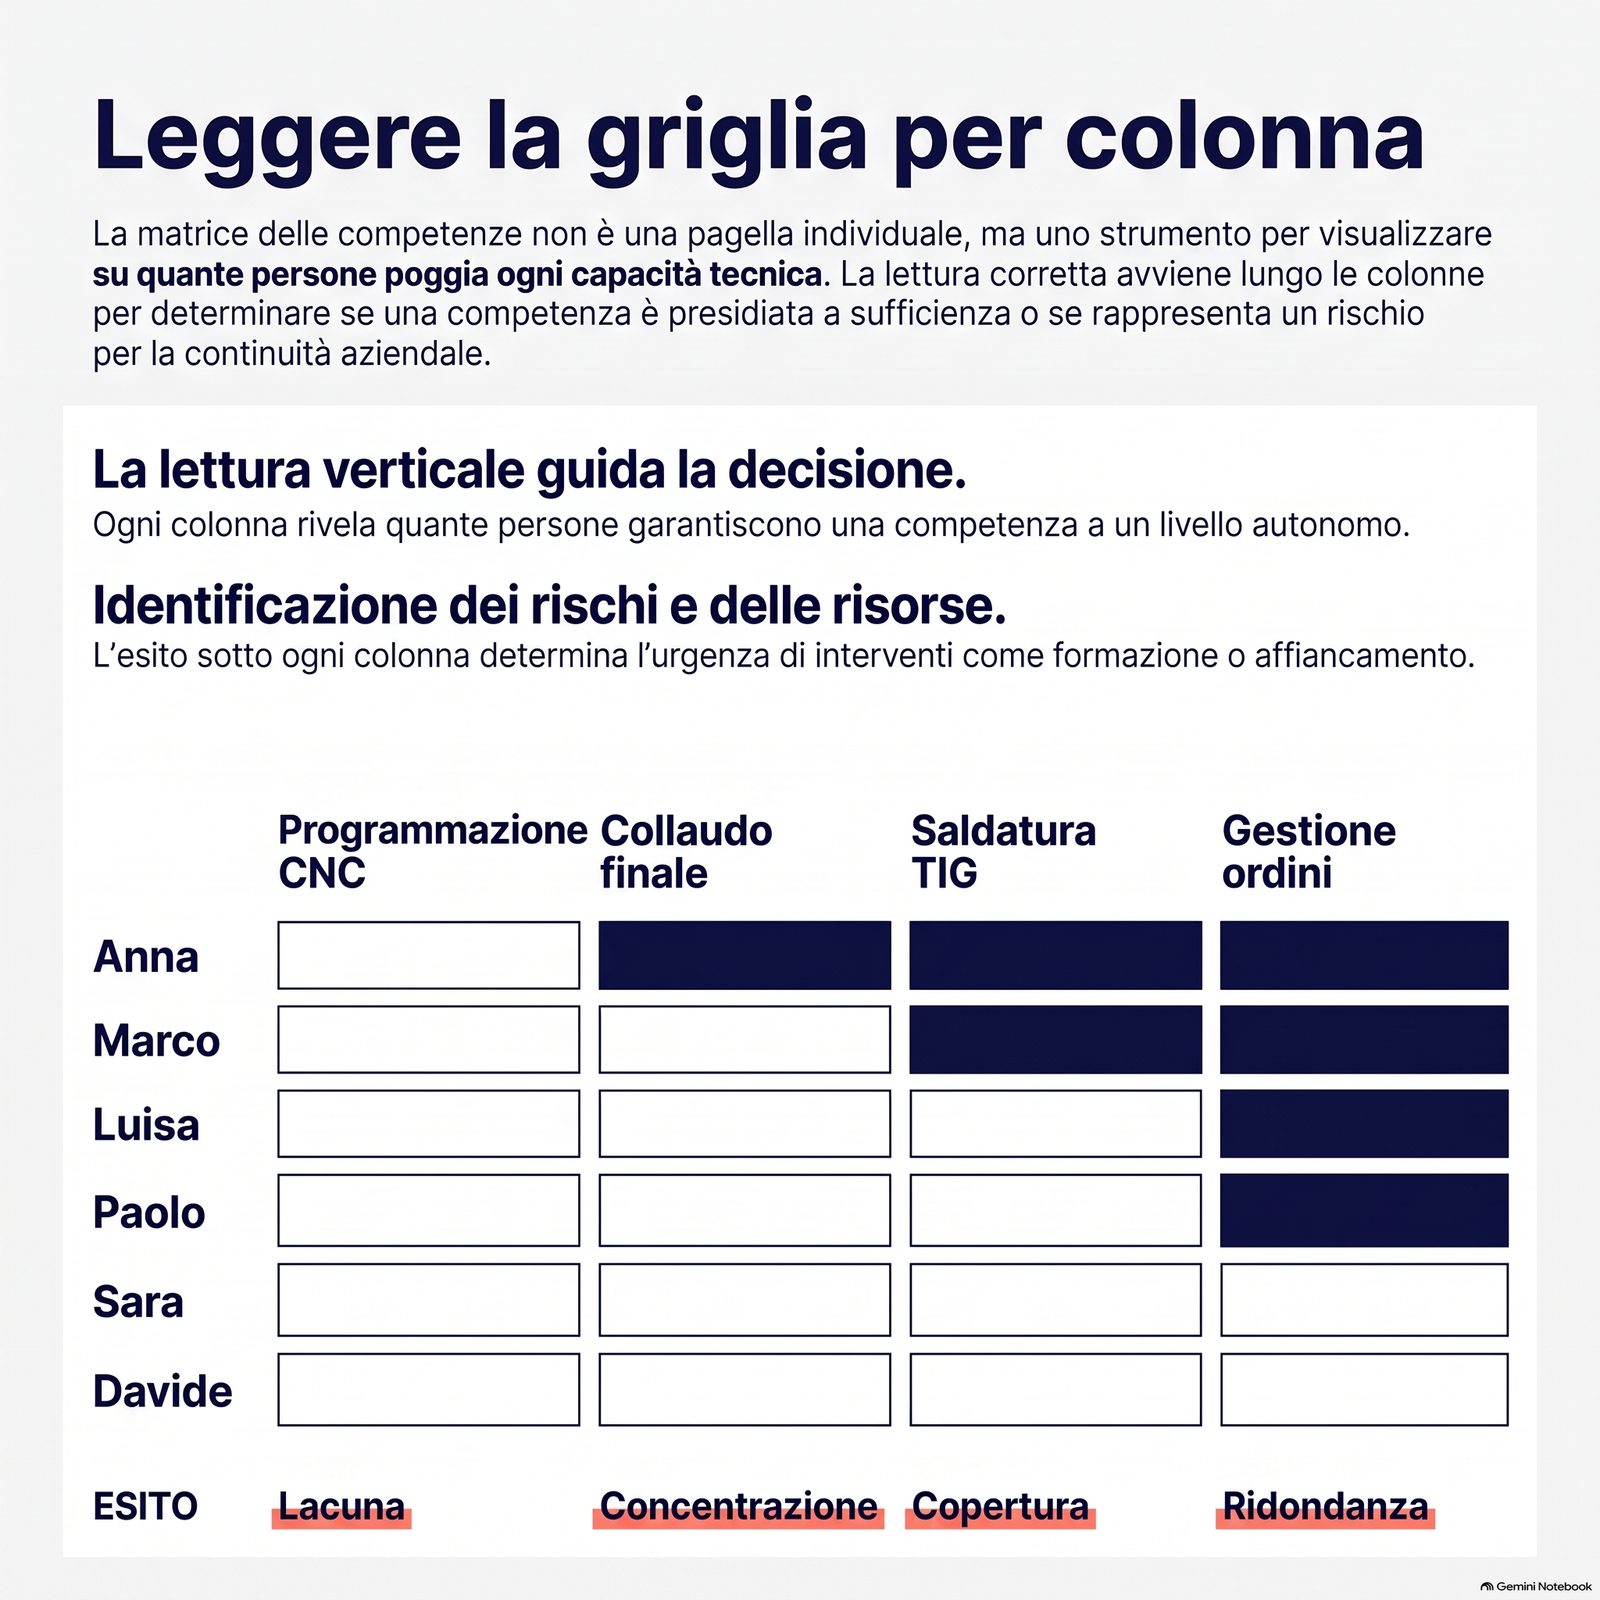
The grid is not read by row, like a report card on the people in it: it is read by column, and the column says one thing only — how many people can handle that skill at a level that allows them to work without supervision.
With the threshold set at the independent level, every column falls into one of four outcomes: no one above the threshold is a gap, one person alone is a concentration, two are coverage, three or more are redundancy.
The two situations that call for a decision are the first two, and for opposite reasons: a gap says something cannot be done today, a concentration says it can be done as long as that person is there.
This section shows how to count, where to look first and why aiming to bring everyone to the top level on everything is the wrong reading.
| Column outcome | What you see in the grid | What it means in the department | Urgency |
|---|---|---|---|
| Gap | No cell above the threshold | The task cannot be done in-house today | High if a job requires it in the coming months |
| Concentration | Only one cell above the threshold | Work continues as long as that person is present | High even when the absence has not happened yet |
| Coverage | Two cells above the threshold | One person's absence can be absorbed | Low, the column is kept under observation |
| Redundancy | Three or more cells above the threshold | There is room to shift workloads | No action needed, it is available capacity |
A simulation study on production lines, with two authors from the Politecnico di Milano, points to two things: which tasks a person can be assigned to and how proficiently they perform them are separate pieces of information, and most of the benefit comes from short, targeted overlaps rather than from training everyone to do everything [5].
It is a methodological indication derived from a model, not a measured result.
The same column, read against the job description, also tells you whether a skill is really needed for the role or whether the business is paying for it without using it.
Concentration also affects continuity: a column with a single cell becomes a delivery problem as soon as that person leaves.
Counting by column does not settle anything on its own: it tells you which columns come out of the reading with a decision to make.
From gap to decision: train, shadow, reallocate or hire
Before the grid, the sentence was "we need a CNC programmer"; after it, "two people are at basic level in programming and one is at independent level on a single machine": which of the two sentences can be turned into a decision this week?
Only the second — and in the second, hiring is often not even the best choice, because among Italian companies facing a hard-to-fill position, nearly half choose to take on people with similar skills and complete them afterward [1].
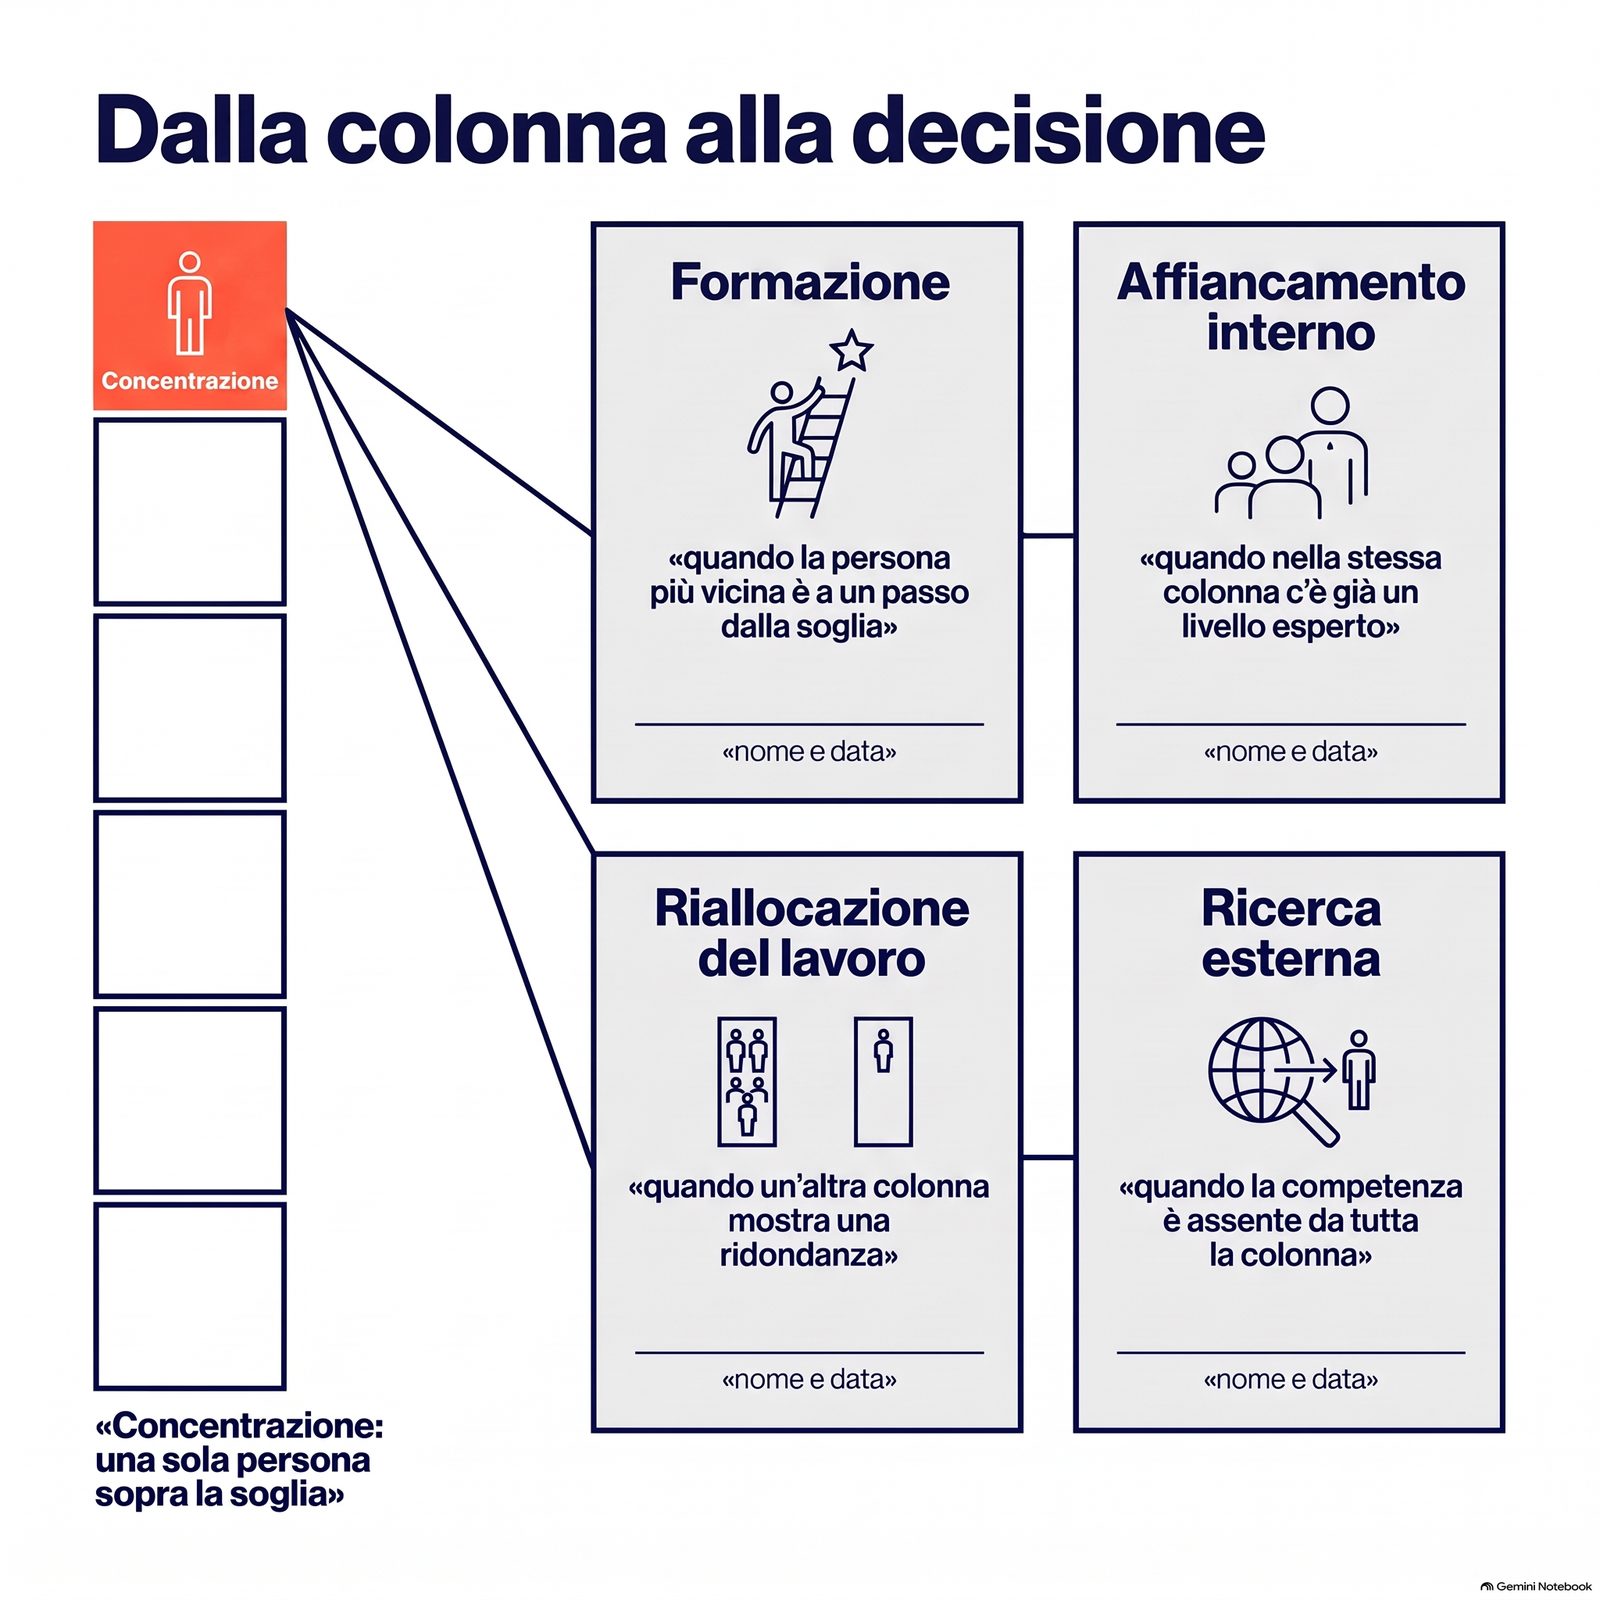
A gap and a concentration are not handled with the same tool, and there are four levers available: training someone already in the company, organizing shadowing between two people on the same team, reallocating work by moving the task to someone who already handles it, or looking for the skill outside.
The choice rests on three variables that can all be read inside the grid: how far the closest person is from the threshold, how much time is left before the gap affects a delivery, and whether the same column already has an expert-level person to learn from.
This section lines up the four levers with the condition for using each one and closes on the point that ties them together: every row of the grid that calls for a decision leaves the session with a name and a date, otherwise the matrix was filled in for nothing.
That share is 46.6% of hard-to-fill hires, not of companies or of total hires [1].
The difficulty exceeds half of hires in companies with fewer than ten employees, stays close to that up to forty-nine, and in metallurgy and metal products reaches 64.2% [1].
| Lever | When it is the right choice | What it costs | Who decides |
|---|---|---|---|
| Training | The closest person is one step from the threshold and the critical delivery is not imminent | Hours taken away from the department plus a direct teaching cost | Whoever holds the budget, on the manager's proposal |
| Internal shadowing | The same column already has an expert-level person able to teach | The time of two people instead of one, for a few weeks | The department or area manager |
| Work reallocation | Another column shows redundancy and the task can be moved | A rebalancing of workloads and a review of existing agreements | The manager, together with whoever takes on the task |
| External hiring | The skill is missing from the entire column and the time before delivery is short | Months of recruiting and onboarding plus a new fixed cost | The owners or senior management |
A hypothetical case built for teaching purposes: a make-to-order engineering company in an industrial district, thirty people across the shop floor, administration and design, two CNC lathes and only one person who can program them.
The programming column has one expert level and seven empty cells, and it is the company's most expensive concentration.
The decision is not to open a search but to bring the people at basic level above the threshold, through shadowing on low-criticality jobs and a review date.
How to run the shadowing is covered in the article on employee training: here the grid tells you who shadows whom and on which skill.
Reallocation is the lever most often forgotten, and it is not always feasible.
When the route is external hiring, the step from the grid to the job posting is in the guide to people management.
The path of an individual person over time is the subject of employee upskilling: here the snapshot stays at department level.
The sentence that becomes a decision is the second one, and it becomes one when every gap and every concentration comes out with a name and a date.
How often to update the matrix and who assigns each person's level
A level assigned by the manager after looking at the past few weeks of work, and one assigned by the person in a self-assessment: which of the two holds up when you have to decide who takes the job forward?
The first, and not out of distrust: a self-assessment answers the question "how capable do I feel," while the grid needs the answer to a different question — "did this work go out without anyone having to check it?"
A matrix is updated twice a year on a fixed schedule, and in between it is touched only when one of three things happens: a person joins or leaves, a new machine or process comes in, or a training program or a shadowing period ends.
The level is assigned by whoever sees the finished work — the department or area manager — using the level's verification question rather than an overall impression, and the person concerned knows it, because a grid kept hidden stops being updatable at the first objection.
For companies with a certified quality management system, updating is not a good habit but a requirement: the quality standard requires you to determine the necessary competence, ensure it on the basis of education, training or experience, and retain documented evidence of it [6].
This section sets out the schedule, the three events that bring it forward, who signs off on the level and what is kept on record.
The three events affect different things.
- A person joins or leaves: update the names and recount the outcomes.
- A new machine or process: add a column, which starts as a gap.
- Training or shadowing completed: the level goes up if the verification question is answered by real work.
The requirement applies to the edition of the standard in force at the date of publication; for those who are not certified, the obligation changes, not the substance.
The official survey counts shadowing among training activities, carried out in 2020 by 66.1% of Italian companies with ten to forty-nine employees [2]: "we don't do any training" is false more often than it seems — what is missing is the record, not the activity.
An up-to-date grid lets you tell a person what they need to be able to do to move up a level, a practice reported by about one in five small Italian companies, which link autonomy to specific skills [3].
As a rule, the review is not done during the performance review meeting: put together, the two contaminate each other and the level becomes negotiable.
The level that holds up is the one signed off by whoever sees the finished work, while what breaks a matrix happens earlier, when it is being built.
The mistakes that empty a skills matrix, with the fix alongside
A grid filled in by the business owner in half an hour at the desk, and one filled in over an hour with the two department managers: which one survives the first objection from a team member?
The second, because the first contains the reconstruction of someone who does not see the finished work every day — and a single disputed level is enough to call the whole grid into question.
The mistakes that empty a matrix look alike from one company to the next, and almost all of them come from confusing it with something else.
You list every skill imaginable instead of those that stop a delivery; you assign the level based on role or seniority instead of the work produced; you fill it in alone and present it to the others already finished; you use the grid to say how much a person is worth instead of how many people can handle a skill; you leave the session without a single decision; you never open it again.
This section lists them with the sign that lets you recognize them as they happen and the fix alongside.
| Mistake | The sign that it is happening | The fix |
|---|---|---|
| Grid too wide | After the first round no one reopens it | Keep only the skills whose absence stops or slows down a delivery |
| Level assigned by role or seniority | Levels follow the order in which people were hired | Apply the level's verification question to the past few weeks of work, as the Invind survey scale does when it separates ability from seniority [4] |
| Grid filled in by one person alone | At the first objection the whole grid is called into question | Fill it in together with those who see the finished work every day |
| Grid used as a judgment on people | After the first complaint all the levels go up together | Read it by column, not by row, and keep it out of the performance review meeting |
| No decision downstream | This year's training plan is identical to last year's | Make every gap and every concentration come out with a name and a date |
| Grid never updated | It still lists people who no longer work at the company | Apply the six-month schedule and the three events that bring it forward |
The fourth mistake weighs more where ownership is in family hands, and in Italy that is the case for 80.9% of companies with at least three employees, with third-party managerial management at just 1.4% of these [3].
There, whoever fills in the grid is usually also the person who hired each employee, and reading by column is what separates an analysis of who covers what from a settling of scores.
The grid that survives the objection is the second one, because the levels were written by people who can show them.
Limits and conditions of applicability
The case of the make-to-order engineering company is hypothetical and built for teaching purposes: the numbers serve to show how to move from the column to the decision, not to estimate a result.
The study cited on multi-skilling [5] is a simulation on production lines and not a survey of companies: we take its methodological indication, and the authors state that the chosen configuration is not independent of the rules by which work is assigned.
The matrix tells you where a skill is missing, not why: the cause may lie in training, tools or workload, and must be investigated separately.
For a small group of people who all do the same job, the grid adds little; its value grows when the number of distinct skills exceeds the number of people.
The level remains a human judgment expressed through a verification question, so it is comparable within the same company and not across different companies.
The Invind scale [4] is cited as a documented measurement tool and not as a count: the document publishes an aggregate score, not the distribution of responses, and the authors describe the analysis as descriptive.
A grid that is not kept up to date produces wrong decisions that look well-founded, which is worse than having no grid at all.
The percentages from sources [1] and [3] have different calculation bases — hard-to-fill hires in the first, companies that considered hiring in the second — and should not be added together or compared.
The quality standard requirement [6] was checked against the catalog entry and not the full text: it is paraphrased rather than quoted, and refers to the edition in force at the date of publication.
FAQ
How do you make a skills matrix in Excel?
The sequence does not change with the medium: in the columns, the skills whose absence stops or slows down a delivery; in the rows, the people within the scope; at each intersection, a level from the four-step scale.
Below the grid, it helps to keep a summary row that counts, for each skill, how many people are at independent level or above.
The real constraint is not the software but making sure the grid lives in one place and can be read by whoever makes decisions.
If you prefer to start from a ready-made model, you will find the same scale and the grid already set up in the Skills matrix by level — template.
How many levels should the scale have?
Four: none, basic, independent, expert.
Each level is valid if it has a verification question tied to real work, and the two that matter most are the independent level, true when the work goes out without anyone else checking it, and the expert level, true when the person can teach the task to a colleague.
Longer scales increase the debate over which level to assign without improving the quality of the decision that comes out of it.
How often should a skills matrix be updated?
Twice a year on a fixed schedule, and in between only when a person joins or leaves, when a new machine or process comes in, or when a training program or a shadowing period ends.
Between one review and the next, the grid is consulted but not changed, so the decisions made in that six-month period remain comparable.
Who should fill in the skills matrix?
It is filled in by whoever sees the finished work, that is, the department or area manager, not whoever ranks highest on the organizational chart.
When there are two or three areas, each manager fills in their own and the levels are compared in a single session, because that is where differences in yardstick come out.
Self-assessment can be used for comparison, never as the source of the level: the verification question concerns the work produced, not the perception of the person who did it.
Do you need a certified quality management system to keep a skills matrix?
No: for certified companies, recording competence and the actions taken to close gaps is a requirement of the quality standard [6]; for everyone else it remains a choice of method.
The difference lies in the obligation to retain evidence of it, not in the usefulness of knowing how many people each task rests on.
Operational summary
Mapping your staff's skills rests on three choices made before you write the first name: which skills go in, who goes in, which scale is used.
A skill goes in if losing it stops or slows down a delivery, the scope goes in if it has a single manager, and a level is valid if there is a verification question that makes it checkable against real work.
Once filled in, the grid is read by column and not by row: you set the threshold at the independent level, count the cells above it, and the outcome is a gap, a concentration, coverage or redundancy.
The columns that call for a decision are the first two, and there are four levers available — training, internal shadowing, work reallocation, external hiring — chosen based on how far the closest person is from the threshold, how much time is left before delivery and whether there is an expert level in the same column.
Every gap and every concentration leaves the session with a name and a date; otherwise filling in the grid has produced nothing.
The grid is reviewed twice a year, plus the three events that bring the review forward, and the level is signed off by whoever sees the finished work.
Conclusion
A skills matrix is not a snapshot of the team: it is the list of skills that today rest on a single person, and every line of that list is a decision someone has to make by a given date.
The grid works for a twenty-person department as well as for a practice with two team members: the names of the skills change, not the way you count them by column.
What to do with the gaps — objectives, schedule, measuring effectiveness — is covered in the training plan guide.
How to run shadowing, with its phases and its final test, is set out in the article on employee training.
A company that reopens the grid twice a year stops discovering its gaps on the day someone resigns.
Training hours go where they are needed, and the question "who knows how to do this?" has one answer for everyone who asks it.
Sources and references
[1] Unioncamere – Ministero del Lavoro e delle Politiche Sociali, "La domanda di professioni e di formazione delle imprese italiane nel 2025", Sistema Informativo Excelsior, 2025 (hiring forecasts of Italian companies for 2025; shares calculated on hard-to-fill hires). Available at: https://excelsior.unioncamere.net/sites/default/files/pubblicazioni/2025/Domanda_professioni_formazione_imprese.pdf
[2] ISTAT, "Formazione nelle imprese | Anno 2020", press release, December 30, 2022 (CVTS survey conducted in 2022, reference year 2020; sample of about 31,000 companies, universe of 198,683 units in industry and services with at least 10 employees). Available at: https://www.istat.it/comunicato-stampa/la-formazione-nelle-imprese-in-italia-anno-2020/ — PDF: https://www.istat.it/it/files//2022/12/REPORT-formazione-imprese.pdf
[3] ISTAT, "Censimento permanente delle imprese 2023: primi risultati", press release, November 14, 2023 (reference year 2022; about 280,000 responding companies, representative of 1,021,618 units with at least 3 employees). Available at: https://www.istat.it/comunicato-stampa/censimento-permanente-delle-imprese-2023-primi-risultati/ — PDF: https://www.istat.it/it/files/2023/11/REPORTCensimprese.pdf
[4] Baltrunaite, A., Formai, S., Linarello, A., Mocetti, S., "Ownership, governance, management and firm performance: evidence from Italian firms", Banca d'Italia, Questioni di Economia e Finanza no. 678, March 2022 (Invind survey, 2019 wave, about 3,200 manufacturing and service companies with at least 20 employees, MOPS section). Available at: https://www.bancaditalia.it/pubblicazioni/qef/2022-0678/index.html — PDF: https://www.bancaditalia.it/pubblicazioni/qef/2022-0678/QEF_678_22.pdf
[5] Costa, F., Thürer, M., Portioli-Staudacher, A., "Heterogeneous worker multi-functionality and efficiency in dual resource constrained manufacturing lines: an assessment by simulation", Operations Management Research, vol. 16, no. 3, 2023, pp. 1476-1489 (Costa and Portioli-Staudacher: Politecnico di Milano, Department of Management Engineering; simulation study). Available at: https://pmc.ncbi.nlm.nih.gov/articles/PMC10115483/ — DOI: https://doi.org/10.1007/s12063-023-00371-2
[6] UNI, "UNI EN ISO 9001:2015+A1:2024 — Sistemi di gestione per la qualità — Requisiti", Ente Italiano di Normazione, in force since October 16, 2024. Available at: https://store.uni.com/uni-en-iso-9001-2015-a1-2024