
Financial management in a business is the set of practices that turns strategic choices into cash flows, budgets and indicators of economic health. It is not the same as accounting (which records events that have already happened) or a business plan (which projects future scenarios for outside stakeholders).
In Italy, on-time payments between companies are declining, leaving the country lagging behind its European peers [3], and cash strain often stays hidden until the first problem hits. The sections below cover cash flow, budgets, indicators and common mistakes.
Treat financial management as a system for looking ahead, not just accounting
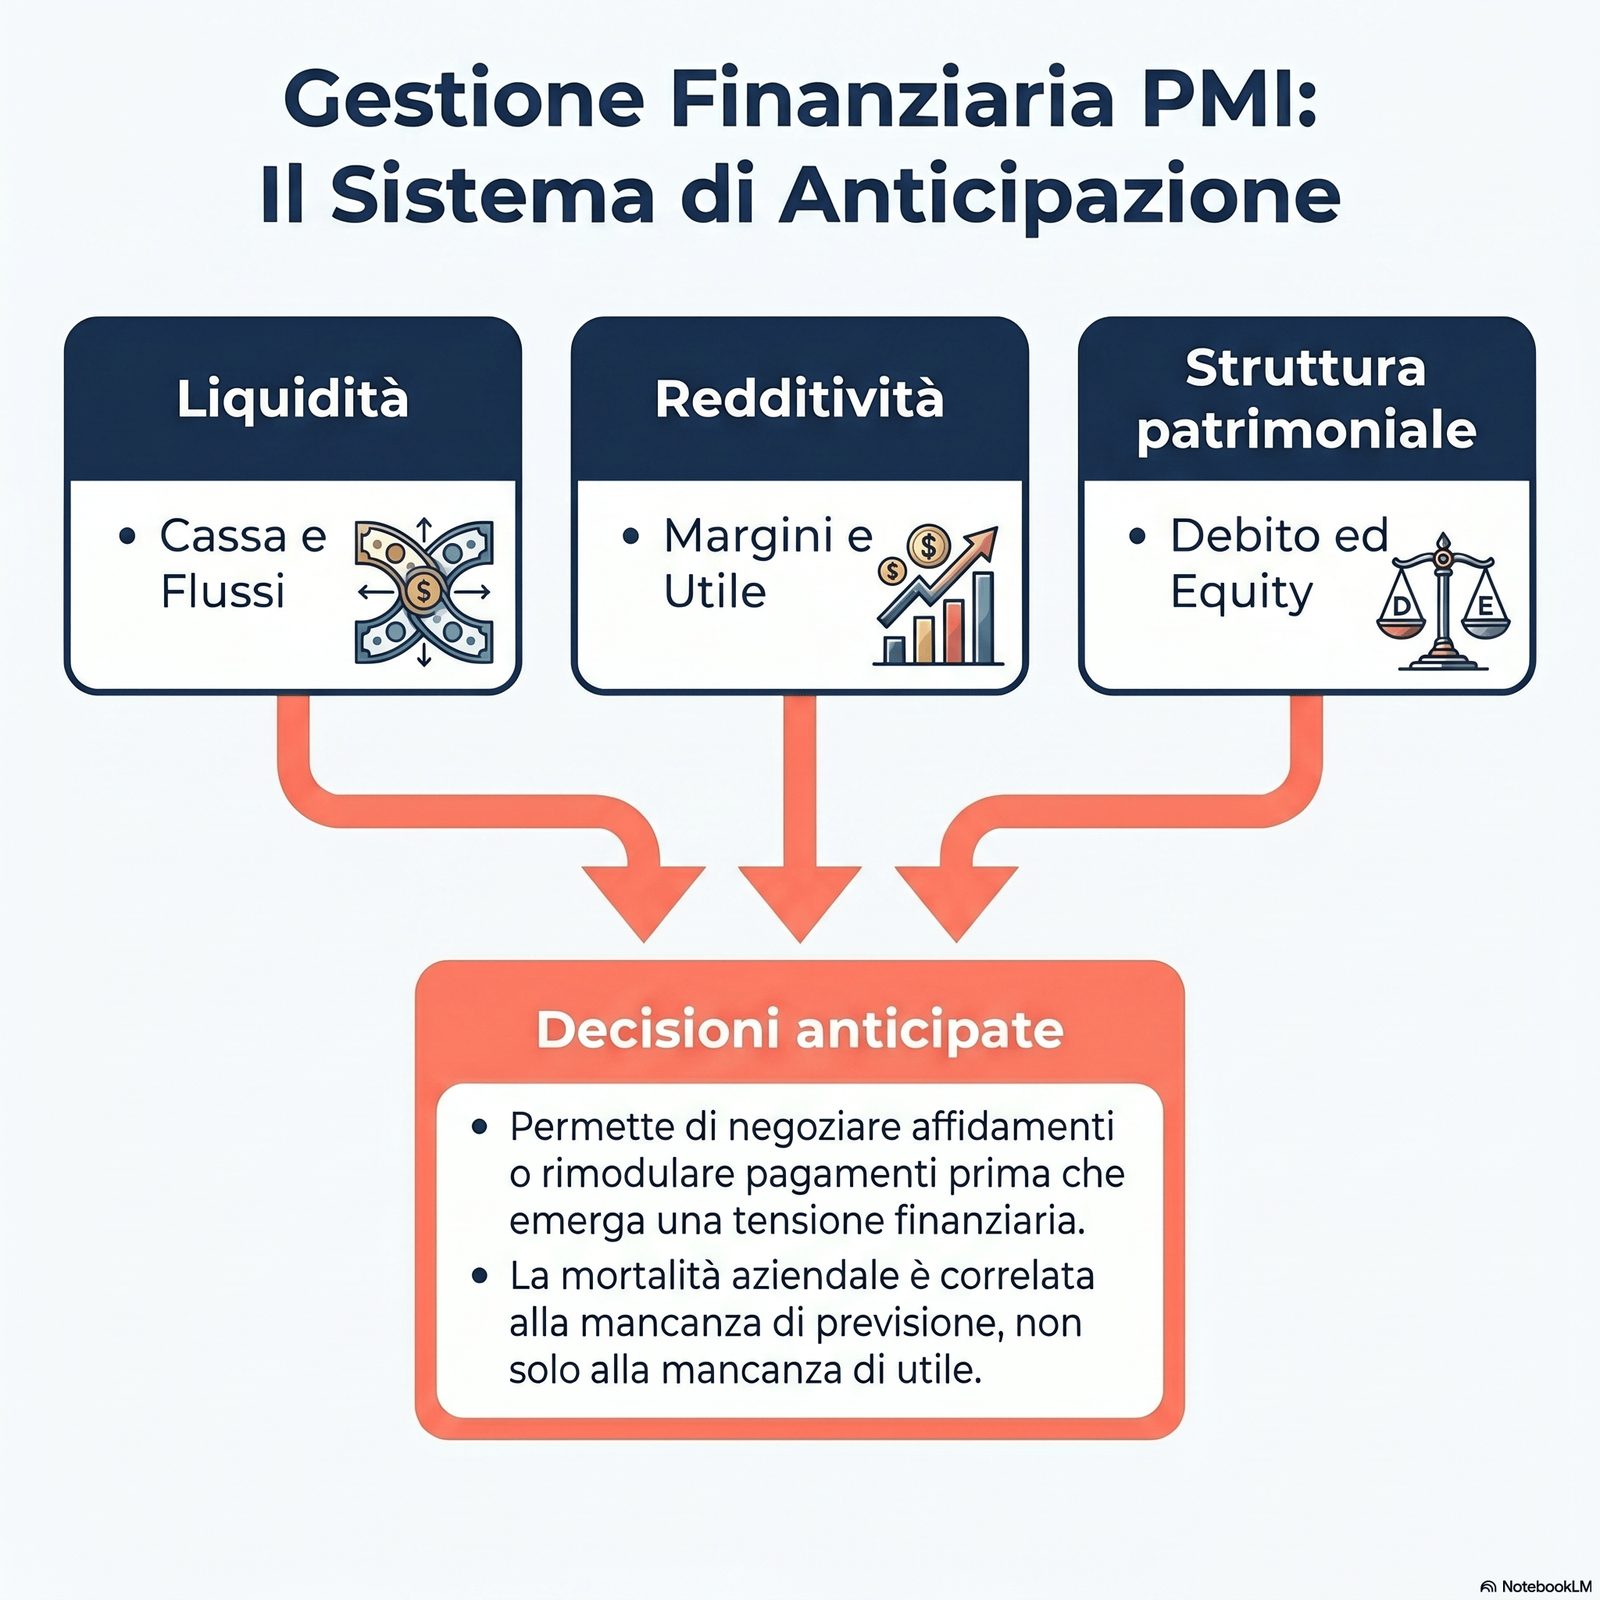
The term "financial management" covers very different activities: from daily monitoring of the bank account to planning capital needs 18 months out. Liquidity crises that hit companies that are profitable on paper show that the problem is almost never the profitability of the period, but the lack of a structured cash forecasting system. Distinguishing what finance measures — liquidity, profitability, financial structure — is the first step to avoid wasting effort on reports.
Is financial management meant to capture the past or to anticipate the future? Flawless accounting will not protect a business from a liquidity crisis six months from now.
The operational distinction starts from three separate dimensions that financial management has to cover at the same time. Liquidity measures the company's ability to meet its payment obligations over the coming days, weeks and months — it is the most urgent dimension and the one least addressed in year-end financial statements. Profitability measures whether the company creates value over time: revenue above costs, with a margin that rewards the capital invested. Financial structure measures how sustainable the debt is and how solid the sources of funding are relative to how they are used.
A common mistake is to focus only on profitability (the income statement) while neglecting liquidity and structure. A company can be profitable on an annual basis and still face a cash crisis during the year, especially during growth phases or after systematic payment delays. This is the gap between profit and cash: in the short term they almost never match.
Financial management as a system for looking ahead produces three distinct outputs: a cash forecast (showing the months at risk), a budget-versus-actual comparison (showing where assumptions diverge from reality), and a dashboard of leading indicators (flagging strain before it becomes a crisis). For the operational health indicators that sit alongside finance, see how to choose business KPIs.
Build an operating cash flow that actually shows the cash coming in
Operating cash flow is the forecast of cash inflows and outflows over the coming months, stripped of accounting items that do not move cash. The critical point is a realistic estimate of collection times. In Italy, for example, companies that paid invoices on time in 2025 were 43.4%, down 1.7 points from the previous year, and the country dropped to twentieth place in the European payment punctuality ranking [3]. A forecast built on nominal rather than observed payment terms produces cash projections that are consistently too optimistic.
Over what time horizon does it make sense to build a cash flow forecast? A 12-month cash flow that is not updated monthly is an abstract projection, not a steering tool.
The most suitable operating setup combines two complementary horizons. The 13-week rolling forecast is the main operating tool: week by week, it shows expected inflows (broken down by customer or channel) and planned outflows (salaries, suppliers, tax deadlines, loan installments). It is updated every week, dropping the week just ended and adding the fourteenth. The 12-month forecast is less granular and is used to identify months that are structurally at risk, so you can act early (bank advances, renegotiating terms with suppliers, rescheduling payments).
The most critical technical step is estimating the actual average collection period (DSO — Days Sales Outstanding). The common mistake is to use the contractual terms: "the customer pays in 60 days." Actual DSO is calculated by dividing total trade receivables on the balance sheet by the average daily revenue of the last 12 months. If contracts say 60 days but observed DSO is 85, the cash forecast should be built on 85.
The difference between the accrual approach (when revenue is earned) and the cash approach (when the money arrives) is fundamental: cash flow only concerns actual movements of money, not revenue recorded in the books. A customer who accepted a €50,000 invoice in March has not yet generated cash if payment will come in June. For the broader operational picture that cash management fits into, also read the guide to business management.
Set up a budget that guides decisions instead of ending up in a drawer
A budget is useful when it produces decisions, not when it produces a year-end summary sheet for the accountant. What matters is how often planned and actual figures are compared, and whether there is a framework that says who decides when a cost departs from the forecast. Without these two conditions, the budget becomes a formality.
How detailed should a budget be for a company with fewer than fifty employees? A budget with a hundred line items produces unreadable comparisons; one with five line items produces crude decisions.
A typical budget is organized into five categories. Revenue by line (or by customer segment) is the starting point: each line has a sales plan with explicit assumptions (volume, average price, conversion rate). Direct costs vary in proportion to production or service delivery: raw materials, subcontracted work, commissions. Overhead costs are fixed or semi-fixed: rent, fixed salaries, utilities, insurance, software. Investments are the capex planned for the year: equipment, hardware, construction work. Financial costs are interest and fees on outstanding loans.
How often the budget is reviewed determines how useful it is in practice. The light monthly review (30–45 minutes) compares planned and actual figures for the main line items, identifies variances above a defined threshold (e.g. ±10%) and records the reason. The structured quarterly review updates the forecasts for the following quarters in light of the observed data.
The operating rule for variances is that every line item outside the threshold must trigger an explicit decision: accept the variance with a stated reason, correct the behavior, or update the forecast. A budget where variances are recorded but do not lead to decisions loses its value within two quarters.
Choose leading financial indicators, not just lagging ones
Measuring only profitability and revenue is a late exercise: by the time the period's figure is available, the decisions that could have changed it have already been made. You need leading indicators — signals that describe the future health of cash and margins. The distinction between lagging indicators (ROS, ROE, EBITDA) and leading indicators (DSO, cash coverage, customer concentration) is central to acting in time.
How many financial indicators does it make sense to focus on? A dashboard with thirty indicators is a sign of indecision, not rigor.
The essential dashboard includes six indicators, each with an operational warning threshold. DSO (Days Sales Outstanding) measures the average collection period: a warning threshold is when it exceeds contractual terms by 20%. DPO (Days Payable Outstanding) measures the average number of days taken to pay suppliers: a DPO that is too high signals strain; too low, a missed opportunity to optimize working capital. Cash coverage in days measures how many days of operating expenses are covered by available cash: below 30 days is a warning zone. EBITDA margin measures operating profitability before depreciation, amortization and financing: useful for comparing performance over time, independent of capital structure choices. Net financial debt / EBITDA measures debt sustainability: values above 4–5 signal a warning level for most Italian companies. Top 5 customer concentration as a share of revenue is a market risk indicator: when the top 5 customers account for more than 60–70% of revenue, losing one of them has a significant impact on cash.
For each indicator, it helps to define the warning threshold and the alarm threshold in advance, and to assign an owner who reviews the figure monthly. To connect this with the operational performance measurement system, also see business performance measurement and how to choose business KPIs.
Manage working capital needs without surprises
Net working capital is the share of cash tied up in trade receivables and inventory, net of payables to suppliers. Working capital needs typically grow along with revenue, and financial strain shows up in the months after an expansion, not during it. Growing without managing working capital is a common cause of liquidity crises in companies that are profitable on paper.
Does a growing business need more financing, different processes, or both? Growing without managing working capital is the fastest way to turn a good year into a cash crisis.
Net working capital (NWC) is calculated by subtracting current liabilities (payables to suppliers, short-term tax liabilities, short-term loan installments) from current assets (trade receivables, inventory, cash). A positive NWC means the company has more liquid assets than short-term liabilities: a balanced condition. A negative NWC signals that the company is funding its current activities with liabilities that fall due before collections come in — a situation that is sustainable only with structured bank credit lines.
The cash conversion cycle is the tool that clarifies the mechanism: it describes the number of days between paying suppliers and collecting from customers. The longer the cycle, the greater the working capital need. Revenue growth, if accompanied by a longer cash conversion cycle, requires more cash even without new fixed investments.
Early signs of working capital strain include: a systematic lengthening of DSO without updating forecasts, inventory growth not matched by revenue growth, and growing delays in paying suppliers as an undeclared form of "self-financing." The OECD report on SME financing documents for 2022 the sharpest increase in the cost of credit to small businesses ever recorded by the survey, together with higher collateral requirements: conditions that discouraged many companies from seeking new debt just as working capital was absorbing cash [2].
Talk to banks and lenders with data that holds up to scrutiny
A company's conversation with a bank or lender hinges on the quality of the data it presents. A credit request backed by a rolling cash flow, an updated budget and consistent indicators leads to different outcomes than one backed only by the financial statements. You cannot improvise these materials when you need the cash.
When should you prepare your financial documentation: before you need it, or when the bank asks for it? Negotiating a credit line under cash pressure is the weakest possible bargaining position.
Financial documentation that stands up to a bank credit analyst's review includes specific materials. The 13-week rolling cash flow shows that the company can forecast its own cash in the short term. The current year's budget, with documented variances from the original forecasts, shows planning capability and the ability to interpret variances. The set of financial indicators (DSO, DPO, EBITDA margin, leverage) allows the lender to read the company's health in a structured way. The note on the assumptions behind the forecasts — explicit, verifiable, consistent with historical data — signals that the numbers were not built to please the reader.
Bank of Italy surveys of Italian industrial and service companies describe subdued demand for credit alongside broadly stable financing conditions [1]: in this context, what makes the difference is the quality of the materials the company brings to the credit review. Preparing documentation continuously — as an output of the financial management system already in use — eliminates the cost of producing it under pressure. For the strategic level that guides investment and financing choices, also read the guide to business strategy.
Common mistakes in business financial management
The most common mistakes in business financial management are not about accounting technique: they are about process and timing. They take different forms depending on industry and size, but some patterns recur. Recognizing them before facing an expansion or a period of strain reduces the cost of the mistake.
Which of these mistakes does the most damage: confusing profit with cash, or updating the budget only at year-end? Both lead to the same outcome — decisions based on data that is already out of date.
The six most frequent mistakes, each with a small operational fix:
-
Confusing profit with cash. The income statement shows the accrual-based result; cash shows the liquidity available. A company can be profitable and short of cash at the same time. Fix: always read the operating cash flow alongside the income statement, not as a separate document reserved for the accountant.
-
An annual budget that is never revised. A budget built in January and not updated in the following months loses value by the second quarter. Fix: set up light monthly reviews comparing planned and actual figures and updating projections for the following quarters.
-
Lagging indicators only. Monitoring only revenue and EBITDA does not let you anticipate cash strain. Fix: add at least three leading indicators (DSO, cash coverage in days, customer concentration) to the monthly dashboard.
-
Unmonitored customer concentration. A company that depends on one or two customers for more than 50% of revenue is exposed to a concentrated cash risk that does not show up in any balance sheet indicator. Fix: calculate the share of the top 5 customers in total revenue every quarter and set a warning threshold.
-
Reactive management of credit lines. Asking for a bank credit line when cash is already tight is the most expensive bargaining position. Fix: plan liquidity needs 6–12 months ahead and talk to lenders early, when the data is solid.
-
Forgetting tax deadlines in the cash flow. VAT, payroll tax remittances, income tax installments: predictable outflows that are often underestimated in short-term forecasts. Fix: enter all tax deadlines in the rolling cash flow calendar, using the previous year's amounts as a first approximation.
Limits and conditions of applicability
The tools described in this article — rolling cash flow, budgets with periodic reviews, an indicator dashboard, working capital management — produce different results depending on the context.
For very small companies (fewer than 5 employees) or those with very regular revenue concentrated on a few customers who pay on time, a structured financial reporting system may be out of proportion to the benefit. In these cases it is better to start with the 13-week rolling cash flow alone and add indicators only when specific strain emerges.
The Bank of Italy data cited refers mainly to Italian industrial and service companies with more than 20 employees. Whether it applies to professional services firms, where collection cycles are different and there is no physical inventory, should be assessed case by case.
The link between cash forecasting systems and a lower likelihood of liquidity crises should not be read as a direct causal relationship: other factors (quality of management, industry, market structure) play a significant role. It is a working hypothesis, not a guaranteed result.
This article does not constitute financial or tax advice. For specific decisions on debt structure, bank credit lines or tax planning, consult a qualified professional.
FAQ — Frequently asked questions
What is the difference between financial management and accounting? Accounting records events that have already happened and classifies them according to standardized principles: it is a snapshot of the past. Financial management is the system that uses that data to anticipate future decisions: cash forecasting, budget-versus-actual comparison, leading indicators. Accounting is an input to financial management, not a substitute for it.
How often should the cash flow be updated? The 13-week rolling cash flow is updated weekly, dropping the week just ended and adding the fourteenth. The 12-month forecast is updated monthly. Less frequent updates reduce the tool's predictive value.
How many financial indicators does it make sense to monitor? The essential dashboard contains 5–6 indicators: DSO, DPO, cash coverage in days, EBITDA margin, leverage (net debt/EBITDA), customer concentration. Adding indicators is useful only when you identify a specific monitoring need not covered by the basic dashboard.
When is the right time to talk to a bank about a credit line? The best time is when the data is solid and the need is not yet urgent — typically 6–12 months before the expected peak in funding needs. Approaching a bank when cash is already tight leads to less favorable terms and reduces your bargaining power.
How is net working capital calculated? NWC is the difference between current assets (trade receivables + inventory + cash) and current liabilities (payables to suppliers + short-term tax liabilities + short-term loan installments). A positive NWC indicates balance; a negative or steadily deteriorating NWC signals strain that should be investigated.
Operational summary
Useful financial management is a system for looking ahead, not a reporting exercise. Three questions guide how to build this system: does the company know how much cash it will have in 90 days? Does it know where it is departing from the budget, and why? Does it know whether working capital is growing in proportion to revenue, or faster?
There are four operational tools. The 13-week rolling cash flow answers the first question. The monthly budget-versus-actual comparison answers the second. The dashboard of 5–6 financial indicators (with defined warning thresholds) gives an early signal on overall health. The cash conversion cycle calculation answers the third.
Preparing documentation for banks and lenders is not a separate activity: it is the natural output of a financial management system that already works. A company that produces cash flow, budgets and indicators on an ongoing basis does not need to prepare anything special when the time comes to talk to lenders — it only has to gather what it already produces.
Sources and references
[1] Banca d'Italia, "Indagine sulle imprese industriali e dei servizi nell'anno 2025", Banca d'Italia — Statistiche, July 2026. Available at: https://www.bancaditalia.it/pubblicazioni/indagine-imprese/2025-indagini-imprese/index.html
[2] OECD, "Financing SMEs and Entrepreneurs 2024: An OECD Scoreboard", OECD Publishing, Paris, 2024. Available at: https://www.oecd.org/en/publications/financing-smes-and-entrepreneurs-2024_fa521246-en.html
[3] Il Sole 24 Ore, S. Uccello, "Pagamenti delle aziende, l'Italia perde posizioni nel ranking europeo", May 28, 2026. Available at: https://www.ilsole24ore.com/art/pagamenti-aziende-l-italia-perde-posizioni-ranking-europeo-AIB8EwFD
Useful financial management is not measured by the precision of the bookkeeping, but by the ability to anticipate cash, margin and investment decisions before the situation becomes reactive. Rolling cash flow, an up-to-date budget, leading indicators and working capital management are the four pillars that turn finance from a snapshot of the past into a guide to the future.
The thread that ties these elements together is consistency over time: every financial decision made this week affects cash this quarter, and the quarterly forecast guides the credit decisions for the year. When this thread breaks, the company discovers financial problems late and faces them from a weak bargaining position. For the strategic level upstream, also read the guide to business strategy; for turning indicators into operations, how to choose business KPIs.
A business that manages its finances stops discovering problems when the accountant presents the year-end statements. It knows the periods of strain in advance, prepares documentation before it is needed, and negotiates with banks and suppliers from a calmer position. It is a change of stance within reach of organizations of any size, as long as finance becomes an ongoing practice, not an end-of-period exception.