
The problem tree is there to take it apart.
It is a graphic representation of a negative situation that arranges the effects at the top, the core problem in the middle and the causes with their sub-causes below, on three levels [1].
It works for a professional with two team members, for a fifteen-person family business and for a hundred-person organization: the size of the drawing changes, the reading does not.
That breaking a problem down is not an automatic reflex is shown by one figure: 35.1% of Italian companies with at least ten employees suffered supply disruptions in 2021-2022, and 48.0% of those considered them temporary and adopted no strategy at all [3].
The problem tree is not there to find the solution: it is there to keep it out until the problem has been broken down. It is only as good as the sentences written on the cards, and "lack of X" is not a cause, it is a solution turned inside out.
What follows: what holds the drawing together, how to write the cards, the six steps to build it, a filled-in example, the criterion for choosing the branch and the typical mistakes.
What holds a problem tree together: effects, problem, causes
Is "customers are complaining" a problem, or is it the label on a folder that contains ten different problems?
Usually the second, and that is why there is a tool that takes the sentence apart.
The problem tree is a graphic representation of a negative situation, built to show the cause-and-effect relationships among the problems identified [1].
The drawing has three levels, and the name of the tool tells you how they are arranged.
In the middle is the trunk: the core problem, written in a single sentence.
Below, toward the roots, are the causes and their sub-causes, generated by a question that keeps repeating — "and what causes this?".
Above, toward the branches, are the effects: what the problem produces, which is usually the part that makes noise.
The placement rule is mechanical: problems that directly cause the starting problem go below, those that are its direct effects go above, and two causes that contribute to the same effect sit side by side on the same level [1].
Four closely related expressions need to be separated right away.
Problem analysis is the work phase, and the tree is the tool used to carry it out; albero dei problemi is simply the Italian name for the same object, not a parallel method.
The objective tree is the same drawing rewritten in positive terms: negative situations become desirable outcomes, and cause-and-effect links become means-ends links [1].
The Ishikawa diagram, by contrast, sorts causes into categories — people, methods, materials, machines — and does not represent effects: anyone who needs that kind of order will find it in the Ishikawa diagram.
The tree does one thing only: it holds effects, problem and causes together in a single drawing, so you can see at what level you are talking.
It does not measure the causes, does not rank them by weight and does not, on its own, tell you where to intervene.
"Lack of X" is not a cause: how to write the cards
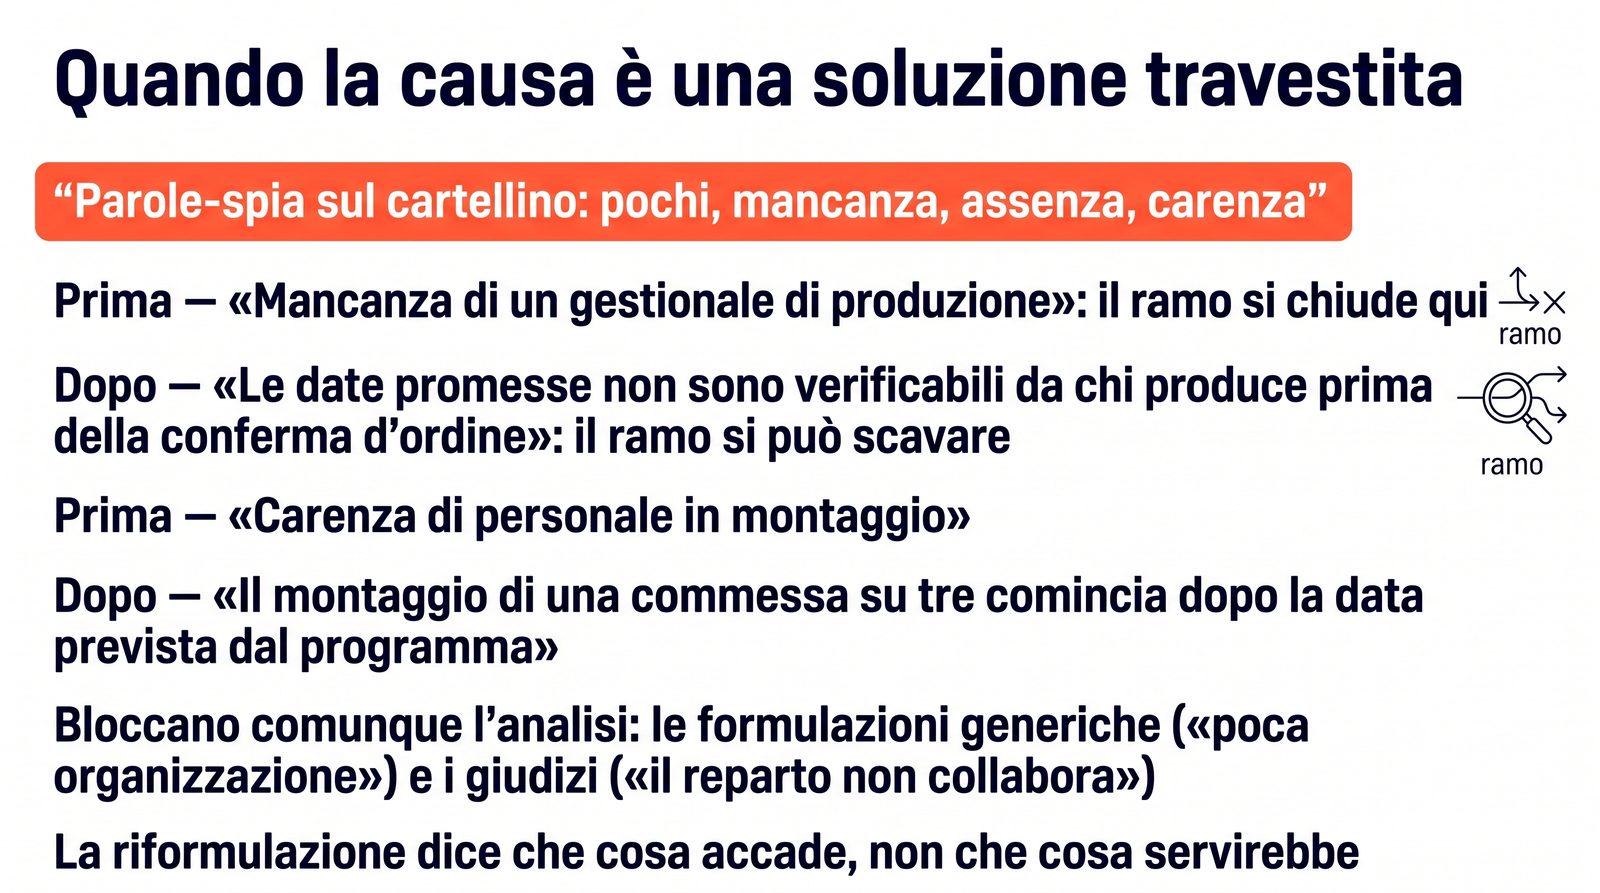
The tree is only as good as the sentences written on the cards: a cause that names what is missing has already chosen the solution and has closed the branch before digging into it.
Two meetings about the same delay: in the first, the cause written down is "lack of production management software"; in the second, "promised dates cannot be checked by production before the order is confirmed".
Did they produce the same tree?
No: the first has a branch that ends immediately, because under a missing solution there is nothing left to look for.
The Treccani Italian dictionary defines problem as a situation or fact that presents difficulties, obstacles or drawbacks to be faced and resolved [5].
The definition already contains the criterion: a problem is something that is happening now, not the absence of the tool that would be needed.
University teaching material on the project cycle calls formulations that hide the answer "disguised solutions", and lists the warning words: few, lack of, absence of, shortage of [2].
The rule is easy to apply because it is lexical: if the card starts with one of those words, what follows is the solution someone is already thinking of, and the real problem has been left outside the room.
Rephrasing means saying what is happening, or what people are unable to do, instead of saying what would be needed [2].
"Shortage of staff in assembly" becomes "assembly on one order in three starts after the date set in the schedule".
Under the second sentence you can dig: standard times in the schedule, staff moved to other urgent jobs, materials not ready.
The same source points to two other formulations that block the analysis: problems written in generic or abstract form, and problems written as judgments or opinions [2].
"Poor organization" belongs to the first category, "the department doesn't cooperate" to the second.
Neither can be verified against a document, and what cannot be verified will not support the branches hung on top of it.
Six steps to build a problem tree in a meeting
A meeting where the business owner presents the problem and everyone else nods, and one where six people write on cards and move them around on the wall: same tree?
The difference is not one of style but of available material, because what does not get written down does not make it into the drawing.
European project cycle manuals place the construction of the tree in a group setting led by a facilitator, and warn that the quality of the result depends on who takes part [1].
Italian teaching material suggests groups of ten to fifteen people and recommends building several trees with different participants [2].
In Italy, this recommendation has to be read against a specific ownership structure: in 2022, 80.9% of companies with at least three employees were controlled by an individual or a family, and in most cases management was in the hands of the business owner or a relative [3].
The room tends to have a single head: bringing in the people who see the work go by — whoever schedules, whoever assembles, whoever answers the customer — supplies the missing perspectives.
You need cards, a free wall and one rule: one sentence per card.
- Write the core problem in a single sentence, with a number and a period: phrasing it well is a job in itself, to be done before calling anyone in.
- Collect in writing the problems considered priorities, without discussing them while you collect them [1].
- Choose the starting problem among them and stick it in the middle of the wall [1].
- For every other card, decide one thing only: if it is a cause of the starting problem it goes below, if it is an effect it goes above, if it is neither it goes beside it, on the same level [1] [2].
- Draw the arrows and reread the drawing from the top and from the bottom, asking the group whether anything is missing [1].
- Stop before it becomes unreadable: the tree must remain a simplified version of reality [1].
What is left on the wall at the end of the session is a drawing, not yet a decision.
A problem tree example for deliveries that go out late
"We're missing our delivery dates" on the whiteboard, and the same problem broken down on a wall of cards: which of the two produces a decision?
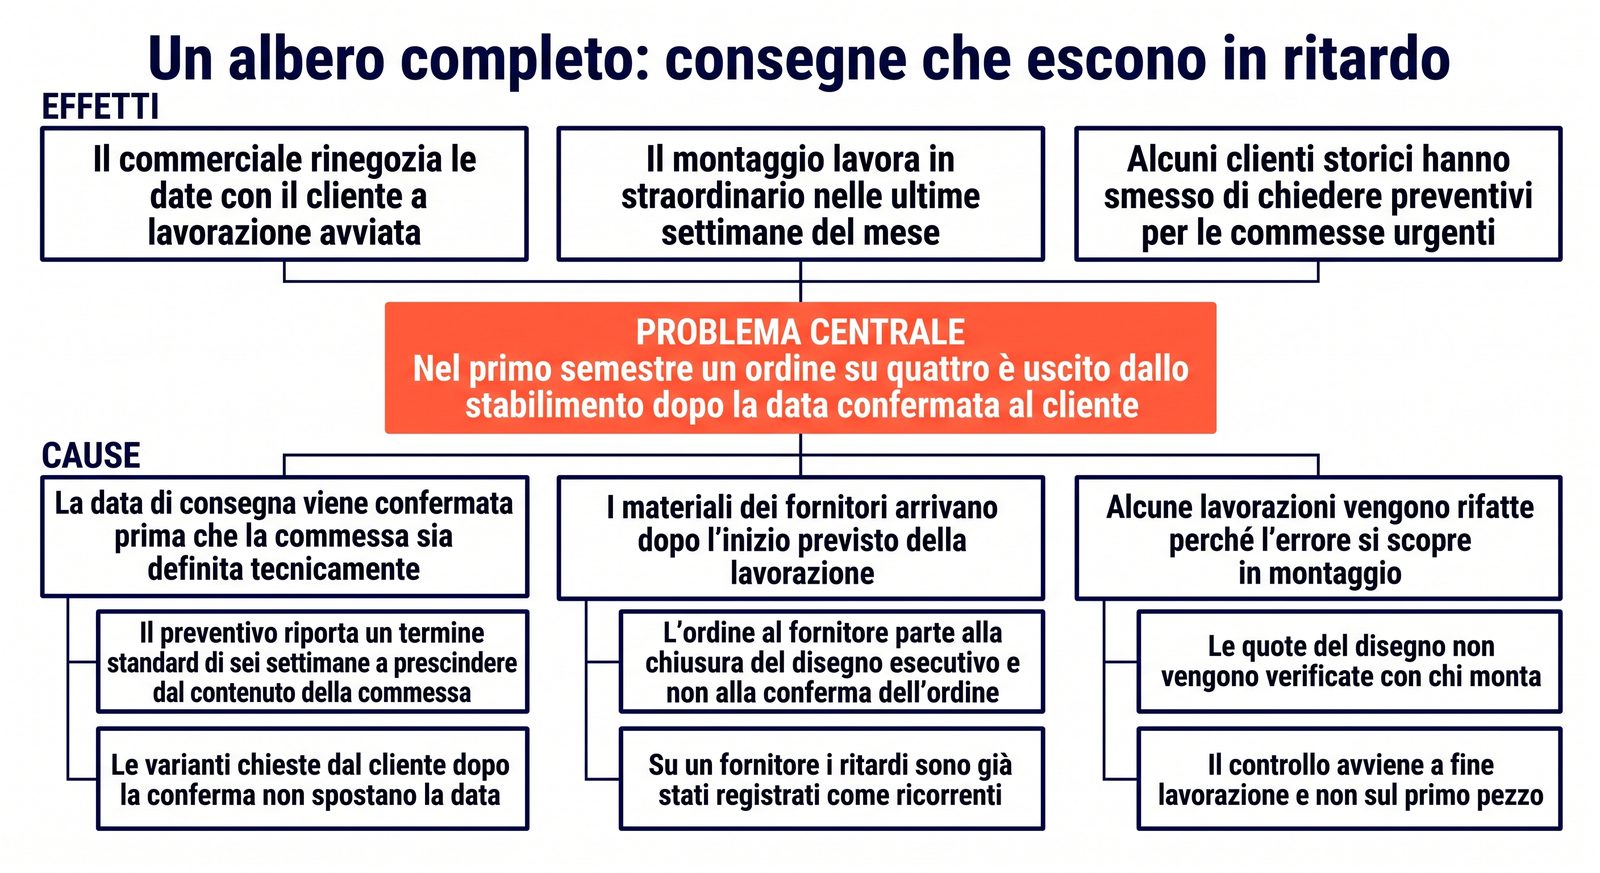
The case is hypothetical and built for this article: a thirty-five-person family business that makes custom furniture to order.
The trunk. The core problem was written like this: "In the first half of the year, one order in four left the plant after the date confirmed to the customer".
One sentence, one figure, one period: everything else is either a cause or an effect.
The branches, above. Three effects were collected: sales renegotiates dates with the customer after work has started, assembly works overtime in the last weeks of the month, some long-standing customers have stopped asking for quotes on urgent orders.
They are the visible part, and in the meeting they come up first.
The roots, below. Three causes emerged at the first level, placed side by side because they contribute to the same effect.
- The delivery date is confirmed before the order is technically defined.
- Materials from suppliers arrive after the scheduled start of production.
- Some work is redone because the error is discovered during assembly.
Under each of them, the same question opened a second level.
- The quote states a standard lead time of six weeks regardless of what the order contains; changes the customer requests after confirmation do not move the date.
- The supplier order goes out when the detailed drawing is finalized, not when the order is confirmed; with one supplier, delays have already been recorded as recurring.
- Drawing dimensions are not checked with the people who assemble; inspection happens at the end of production, not on the first piece.
During the meeting, one card said "lack of production management software".
It was removed from the causes and rewritten as "promised dates cannot be checked by production before the order is confirmed".
The software stays in play as a possible intervention, but among the answers, not among the roots.
Read as a whole, the drawing says what the sentence on the whiteboard did not: the delay originates upstream of production, in the way the date gets promised.
From drawing to decision: which branch to work on
A wall full of cards and an agenda that is still empty: has the tree done its job, or has it stopped halfway?
It has stopped halfway, because the drawing shows how things fit together and does not say where to start.
Three criteria narrow the choice, in this order.
- Control. Keep in play the sub-causes the company has the power to act on; those that depend on external conditions stay written down as constraints to monitor.
- Depth. Go down until the sub-cause stops being an explanation and becomes a fact that can be verified in a document or a procedure.
- Convergence. A sub-cause that appears under several branches is worth more than one that feeds a single branch: one intervention produces effects at two points in the drawing.
The branch you choose is not the longest one, and not the one that made the most noise in the meeting.
Once the point is fixed, the drawing is flipped: negative situations become desirable outcomes and cause-and-effect links become means-ends links [1].
This is the step that turns the problem tree into an objective tree.
From here a different kind of work begins, and the tool changes depending on the shape of the hypotheses.
When there are many hypotheses coming from different functions, you open them across the width by category with the Ishikawa diagram.
When the chain looks linear, you dig deep with the 5 whys technique.
When the problem is serious or cuts across several departments, the complete framework is root cause analysis; the process all of this fits into is the guide to business problem solving.
The last line on the agenda is the date when you look at the trunk again: same measure, a period of the same length.
If the number written on the trunk has not moved, the intervention acted on a branch that was not holding it up.
The mistakes that turn a problem tree into a drawing pinned to the wall
A tree photographed at the end of the meeting and then forgotten, and one looked at again after three months with the same trunk: which of the two changed anything in the department?
The four mistakes below are not about the drawing but about the sentences and the people that produced it: you spot them by rereading the cards, not by looking at the shape.
Mistaking an effect for a cause. This is the quietest mistake, because the drawing stays tidy even when a level is wrong.
The fix is to read the branch from the bottom up, inserting a "therefore" between one card and the one above it: if the sentence does not hold, the card is on the wrong level.
Stopping at the first level. A cause written once and never questioned remains a category, and you cannot work on a category.
It is the reaction mentioned at the start: the problem is noted and treated as an inconvenience that will pass on its own, so it is never broken down.
The fix is to repeat the question "and what causes this?" until the answer stops being an explanation and becomes a fact that can be verified in a document or a log.
Building it alone. A tree drawn by a single head contains the problems that head runs into; the others stay out of the drawing.
The fix is to build several trees with different groups and compare the drawings [2]; for the problems that have not yet reached the table, the search method is problem finding.
Closing the meeting without a date. The drawing is not the result: the result is a chosen branch, an intervention with an owner and the date when you look at the number on the trunk again.
Without that date the tree becomes a poster, and the organizational problems it described go back to square one.
Limitations and conditions of applicability
The tree is an admitted simplification: the manuals that codify it ask that it remain a robust but simplified version of reality, because a drawing that is too dense stops guiding the next steps [1].
The critical literature on the logical framework puts it more bluntly: in practice almost every problem tree is really a network, because of cross-links and feedback loops, and the insistence on a single core problem serves to obtain a well-defined intervention, not to describe the world [4].
The method was born in the design of development projects and is documented in that context [1]: transferred to a company, it keeps the placement logic, not the examples or the scale.
It also requires time, facilitation skills and organizational commitment, and these requirements are part of the method [4].
The tree does not weigh the causes: it says how they fit together, not how much each one costs, and a ranking by cost or frequency is built with separate counting tools.
The furniture company case is hypothetical and built for this article: the figures serve to show the procedure, not to estimate a result.
The ISTAT figure cited describes how a set of Italian companies behaved when facing supply disruptions [3]: it shows how common it is to treat a problem as temporary, it does not prove causal links in any individual case.
When a problem concerns people's safety or a contractual or legal obligation that is coming due, the intervention does not wait for the tree to be built.
FAQ
Are "albero dei problemi" and problem tree the same thing?
Yes: albero dei problemi is the Italian name for the same tool, a direct translation of the English problem tree.
European project cycle manuals define it as the graphic representation of a negative situation showing a cause-and-effect relationship [1].
How can you tell that a branch is a solution and not a cause?
From the words it is written with: lack of, absence of, shortage of, few usually introduce the solution the writer is already thinking of, and teaching material on the method classifies them as warning words for "disguised solutions" [2].
The remedy is to rewrite the card saying what is happening or what people are unable to do, and to check that the statement can be verified in a document or a log.
How many people do you need to build one, and how long does it take?
The method is designed for a group led by a facilitator, with guidance that tops out at around ten to fifteen people [2]; the quality of the result depends more on who takes part than on how many [1].
For a department-level problem, two sessions of an hour and a half each are a realistic duration: the first produces the drawing, the second corrects it.
What is the difference between a problem tree, an Ishikawa diagram and the 5 whys technique?
The tree holds effects, core problem and causes together across several branches, and helps you choose what to work on.
The Ishikawa diagram sorts causes into categories and does not represent effects; the 5 whys technique goes deep along a single chain.
Both tools are used after the tree, on the branch that has been chosen.
Key takeaways
The starting point is a single sentence, written on the trunk, with a number and a period: as long as the problem remains a generic label, whatever is hung beneath it has nothing to hold on to.
Effects are written above and causes below, and the placement rule is mechanical: direct cause below, direct effect above, causes that contribute to the same effect side by side.
Each card should be reread before it is put up, because the words lack of, absence of, shortage of and few signal a solution disguised as a cause.
The rephrasing says what is happening or what people are unable to do, and it must be verifiable in a document or a log.
The room should be filled with the people who see the work go by, and it is worth building several trees with different groups when the perspectives in the company are few.
The choice of branch follows three criteria in order: actual control, depth down to a verifiable fact, and the same sub-cause appearing under several branches.
The drawing is flipped into positive terms to derive the list of things to do, and from there the work moves to the tool that fits the shape of the hypotheses.
The last line on the agenda is the date when you look at the number on the trunk again, with the same measure and a period of the same length.
Conclusion
The problem tree is not a drawing that solves things: it is a way of keeping the solution out of the room until the problem has been broken down into causes and sub-causes.
It holds up only as well as the sentences written on the cards, and a card that names what is missing has already decided the answer before looking at the problem.
The rest is placement discipline: effects above, the core problem in the middle with a number and a period, causes below, and the question "and what causes this?" repeated until the answer becomes a verifiable fact.
The chosen branch is where a different kind of work begins: root cause analysis when the problem cuts across several departments, and the map of the process all of this fits into in the guide to business problem solving.
After a few trees built on the same recurring problems, the Monday meeting changes shape.
No longer a list of overlapping complaints, but a short drawing with a trunk, three roots and a decision: we work on this sub-cause, and in three months we check whether the number on the trunk has moved.
It is the shift from a company that tackles ten problems at once to one that tackles them one at a time, knowing what each one is attached to.
Sources and references
[1] European Commission – EuropeAid Cooperation Office, "Aid Delivery Methods — Volume 1: Project Cycle Management Guidelines", March 2004, § 5.2.3 "Problem Analysis", pp. 67-68 and glossary. Available at: https://international-partnerships.ec.europa.eu/document/download/f7ed20c4-5fc2-4ed7-b54c-0805e4ed952d_en?filename=methodology-aid-delivery-methods-project-cycle-management-200403_en.pdf
[2] Università degli Studi di Trieste – Department of Political and Social Sciences, "Project management — Analisi dei problemi, albero dei problemi, albero degli obiettivi", course teaching material, lecture of March 15, 2022. It is university teaching material, not a scientific publication: it is cited for the card-writing rules, which it takes from project cycle manuals, and never for data. Attachment on the university's Moodle platform, accessible without credentials as of the access date (September 22, 2026): https://moodle2.units.it/pluginfile.php/450256/mod_forum/attachment/41548/04_LEZIONE_15032022_def.pdf
[3] ISTAT, "Censimento permanente delle imprese 2023: primi risultati", press release, November 14, 2023 (reference year 2022; sample of about 280,000 companies with at least 3 employees, representative of 1,021,618 units). Available at: https://www.istat.it/comunicato-stampa/censimento-permanente-delle-imprese-2023-primi-risultati/ — PDF: https://www.istat.it/it/files/2023/11/REPORTCensimprese.pdf
[4] Gasper, D., "'Logical Frameworks': Problems and Potentials", Institute of Social Studies, The Hague, September 25, 2000. Available in the RePub institutional repository of Erasmus University Rotterdam: https://repub.eur.nl/pub/50949/Metis_165267.pdf
[5] Treccani, "problema", Vocabolario on line, Istituto della Enciclopedia Italiana, sense 3.a. Available at: https://www.treccani.it/vocabolario/problema/