
The question seems idle until you count how many meetings end with a countermeasure decided on an effect described from memory, and how many of those countermeasures are repeated the following month.
The Kepner-Tregoe method answers by reversing the order: four rational processes — situation analysis, problem analysis, decision analysis and potential problem analysis — in which definition comes before explanation and explanation comes before choice.
It applies in a professional practice with two team members, in a family business with fifteen employees and in an organization of a hundred: what changes is who fills in the template, not the sequence.
The difference weighs especially heavily in Italy, where 80.9% of companies with at least three employees are controlled by an individual or a family and, among these, management is entrusted to a manager in 1.4% of cases [4]: the person who defines the problem, the one who looks for its cause and the one who decides are often the same person, in the same fifteen minutes.
Kepner-Tregoe doesn't start by asking why a problem happened: it first asks what exactly happened and what, very similar, did not happen — because the cause hides in the difference between the two columns.
The pages that follow walk through the four processes, the "is / is not" template on a business case, the move to the cause and to the choice, and the mistakes that reduce everything to an exchange of opinions.
A deviation, not an annoyance: what the Kepner-Tregoe method calls a "problem"
In everyday Italian, a problem is "any question whose solution is sought from others or from oneself, usually starting from known elements" [5].
In the method of Charles Kepner and Benjamin Tregoe the starting point is different: a problem is a deviation between what should happen and what actually happens, significant enough that someone believes it should be corrected [1].
This is not a nuance of vocabulary; it is what changes the first move.
You tackle a question by looking for the answer; a deviation you first describe, because behind it lies an unplanned change that produced the unwanted effect instead of the expected one [1].
For a deviation to become a problem, two conditions are needed: someone must recognize it by comparing what should happen with what does happen, and the gap must fall outside the range of variation considered tolerable [1].
This is where the first concrete obstacle appears in Italian companies: 80.9% of those with at least three employees are controlled by an individual or a family, and in these businesses management is entrusted to a manager in 1.4% of cases — 0.8% among those with 3 to 9 employees, 3.2% among those with 10 to 49 [4].
In those companies, the standard against which the deviation is measured is rarely written down: as long as it stays in the head of whoever runs the business, every discussion about the problem becomes a discussion about expectations.
Putting it in writing is the minimum work that comes before the template, and it is the work described in how to write a problem statement: without a stated desired condition, there is no deviation to measure.
Two boundaries keep the definition tight.
A deviation is not a decision: a decision chooses an action among alternatives and looks forward, while problem analysis explains an effect already produced and looks back [1].
And it is not an emergency: a daily annoyance can demand attention immediately while staying within the normal range, whereas a slowly growing gap can exceed it without making a sound.
The method was born precisely from this dissatisfaction: Kepner, a social psychologist, and Tregoe, a sociologist, left the RAND Corporation in 1958 to study how executives actually use information, and spent six months asking managers from different industries what steps they took when facing a typical problem [1].
The four rational processes of the Kepner-Tregoe method and when to use each one
Faced with five open issues in the same department, the useful question is not which one is the most serious: it is what kind of work each one requires.
The method distinguishes four processes, and the first one serves precisely to sort the other three [3].
Situation analysis separates the issues that are piled up together and puts them in order using three criteria: how pressing the timing is, how the phenomenon is evolving, how much the effect weighs — in the original text urgency, seriousness and growth potential [1], in the university course notes that teach the method timing, trend and impact [3].
The outcome is not a ranking: it is the assignment of each issue to the process it needs.
| What you hear in the meeting | Process | What it produces |
|---|---|---|
| "It's five things at once, I don't know where to start" | Situation analysis | an order of work and the process to use for each item |
| "It's been happening for three weeks and we don't know why" | Problem analysis | a verified cause, not a shared guess |
| "We know why, but there are three ways to go" | Decision analysis | a reasoned choice, with constraints stated up front |
| "We've decided, we start on Monday" | Potential problem analysis | preventive actions and contingency plans for the weak points |
The distinction matters because the four processes are not interchangeable.
Asking "why did it happen" when facing a choice between three suppliers leads to a long meeting that never wraps up; debating alternatives when facing a defect of unknown origin leads to costly interventions that leave the phenomenon where it was.
The 1965 book devotes separate chapters to problem analysis, decision making and potential problems, and opens with the chapter on where to begin, which contains the priority criteria [1].
The current formulation in four processes, with situation analysis first, is the one in which the method is taught today [3]; the text has been republished in updated editions starting with The New Rational Manager, Princeton Research Press, 1981 [2].
The sequence that matters to whoever runs a company remains this: first you figure out what kind of question you have in hand, then you choose the tool.
The heart of the method, and the part needed in the "define" step, is the second process.
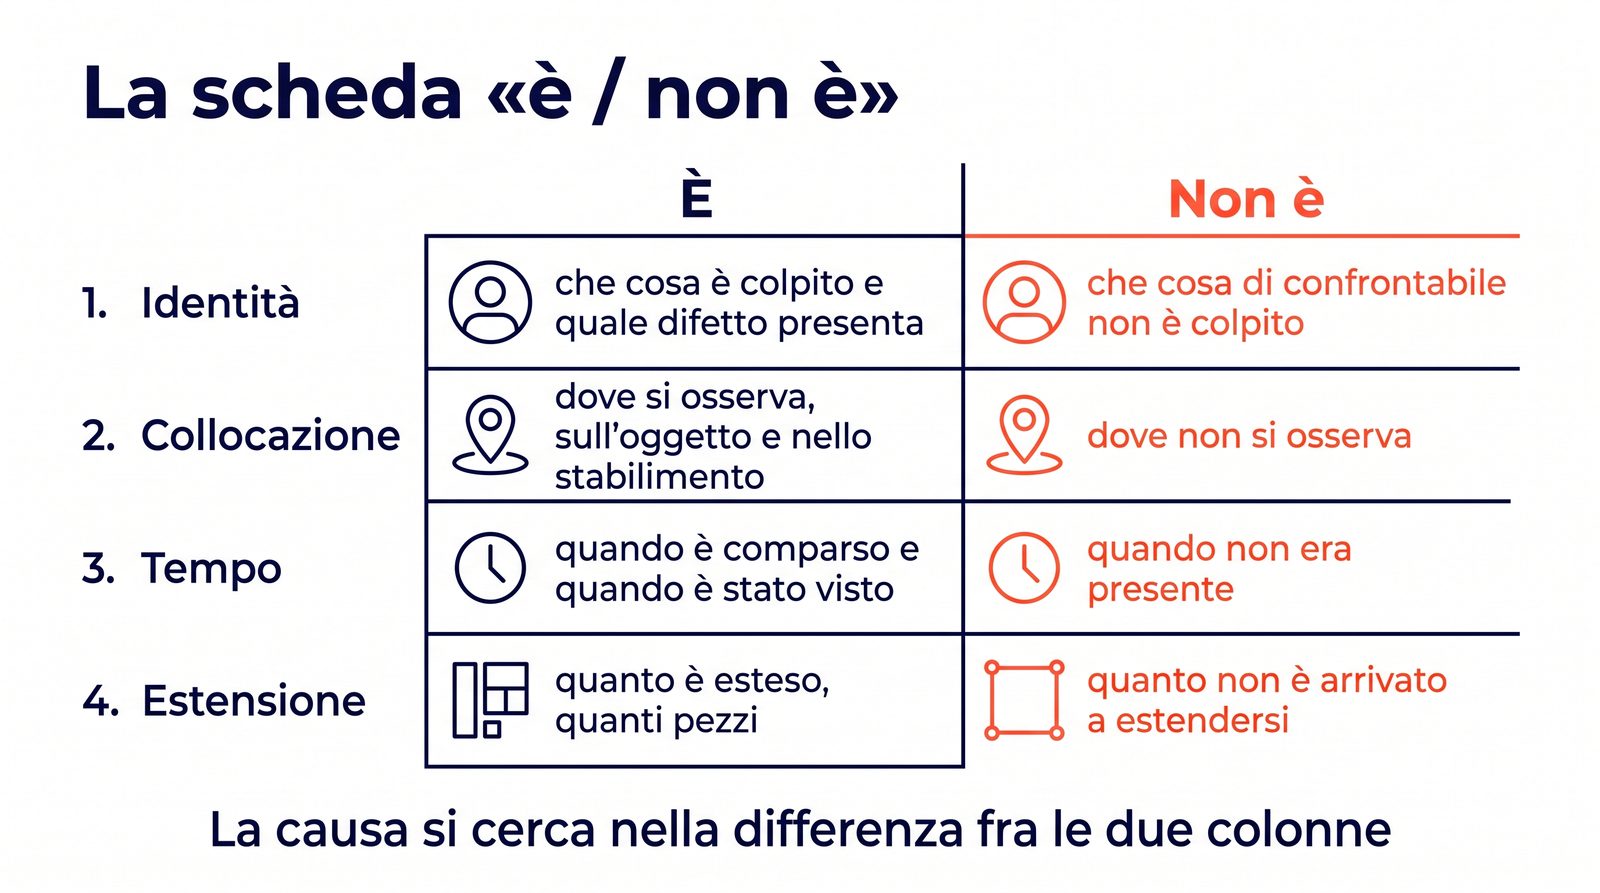
The four dimensions of the "is / is not" template in problem analysis
The cause is not in the left-hand column: it is in the difference between the two columns, and a template with an empty "is not" has no differences to show.
Problem analysis begins with a precise statement of the deviation, not with a round of opinions.
In the example that opens the original text, the deviation is stated like this: carbon deposited simultaneously on all 480 filaments of machine no. 1, starting at 3:52 in the morning and for about ten minutes [1].
The precision serves a practical purpose: to bound the field within which the cause must necessarily lie.
The description is built on four dimensions — identity, location, time and extent — and for each one you answer two questions, not one: what is affected and what, although comparable, is not [1].
The second column is the part that usually gets skipped, and it is the one that carries the information.
The original text puts it in a formula that works as a working criterion: specification is "not a blind hunt for all the facts," but a selective search for facts that draws a boundary around the problem [1].
The following scenario is hypothetical and built for this article: a family-owned contract painting business with eighteen employees, two booths, three shifts.
A dull haze appears on one delivery, the customer reports it, and the department head proposes redoing the batch and calling in the operator on that shift.
Once filled in, the template says something different.
| Dimension | Is | Is not |
|---|---|---|
| Identity | dull haze on gloss white | other paint defects; the gray from the same period, which stayed clean |
| Location | parts from booth 2, on the side facing the booth entrance | parts from booth 1; the opposite side of the same parts |
| Time | parts painted from Tuesday afternoon onward | parts from Monday and Tuesday morning |
| Extent | about one part in three in the batch | the entire batch; later deliveries to other customers |
The rows talk about places and moments, not people, and already the hypothesis of calling in the operator loses ground: the same operator was also working in booth 1, and the defect does not appear on those parts.
When, instead, the plausible answers multiply across different families of causes, the template alone is not enough and it is worth opening up the range with the Ishikawa diagram.
From distinctions to change: finding the cause and testing it
With the template filled in, the search proceeds along two lines, in this order: first the distinctive characteristics of what is affected compared with what is not, then the changes that occurred within or affecting that distinctive area [1].
The order is not a matter of style: looking for changes without having isolated the distinctions means reviewing everything that happened in the company over the last month.
In the original case there were three distinctions: the deposit was carbon, and there was no carbon in the process, so it came from outside; it affected only one machine, which had its own air intake in a different position from the others; it lasted eleven minutes, not an hour [1].
The change that explained all three distinctions together was a coal-burning locomotive standing beneath that air intake during that time slot [1].
Once you have the hypothesis, you state it as a testable proposition — "that change, which occurred at that point and at that moment, could have produced this effect" — and test it against every row of the template [1].
The most probable cause is the one that accounts for the facts in the "is" column and, at the same time, for the absences in the "is not" column [1].
If it needs an additional assumption to hold up, it remains a hypothesis awaiting proof, and must be declared as such [1].
In the painting scenario the work is the same: booth 2 has an independent extraction system, and the haze appears only on the side facing the booth entrance and only from Tuesday afternoon.
The question then becomes a single one: what changed in booth 2 in the middle of Tuesday.
If the answer is a single one and concerns a condition, not a person, the next step is to drill down along that condition with the 5 whys technique, which digs deep where this method has just bounded the field.
The overall family picture — what distinguishes an investigation of this kind from a knee-jerk intervention — is in root cause analysis.
Musts and wants: choosing between options and protecting the choice
A verified cause usually leaves more than one path open, and this is where the method switches process.
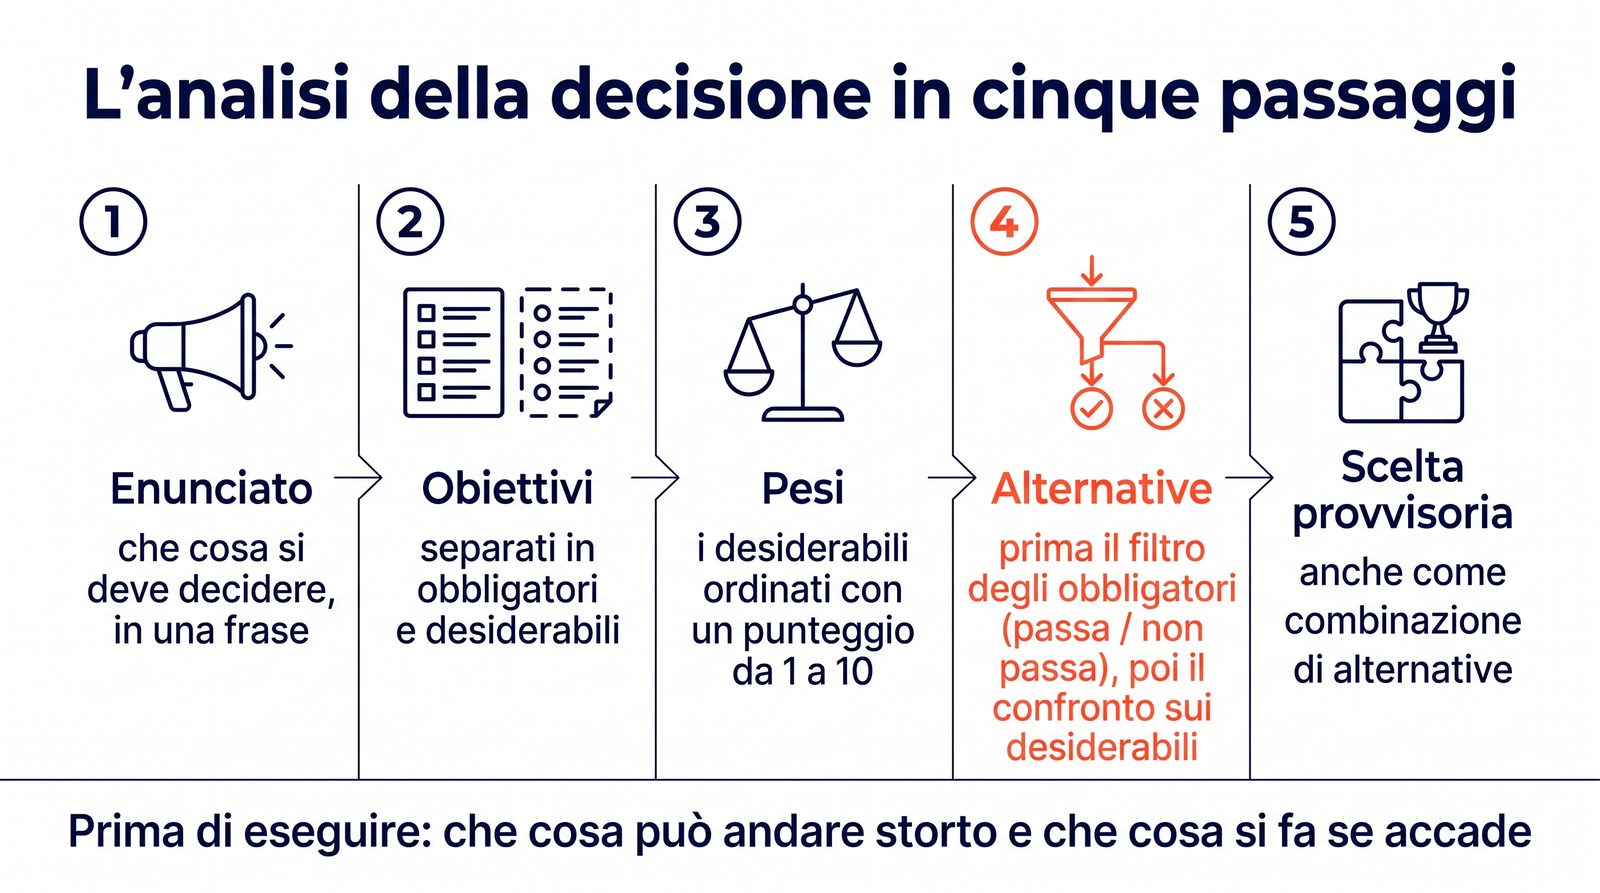
Decision analysis starts from a statement of what has to be decided, then separates the objectives into two categories: mandatory ones, which cannot be negotiated, and desirable ones, which can be traded off against each other [1].
The desirable objectives are ranked and weighted — in the university course notes, with a score from 1 to 10 [3].
The alternatives are evaluated first against the mandatory objectives, with a straight go/no-go judgment, and only afterward against the desirable ones [1].
The tentative choice is the alternative that satisfies the constraints and gets the most of what is wanted with the fewest drawbacks; the text adds that the best path is often a combination of several alternatives, not just one [1].
The grid with criteria, weights and scores is covered in full in the decision matrix: here it is enough to know that constraints are stated before looking at the alternatives, not after.
That leaves the fourth process, the one the 1965 text considers the most profitable and the least practiced.
Potential problem analysis looks for sustainable actions against the causes of problems that have not yet happened, to avoid them or reduce their effect [1].
The obstacle is organizational, not technical: recognition goes to those who show they have fixed today's problems, and there is almost no reward for those who prevented them from happening [1].
For each weak point in the plan, you fill in four boxes [3]:
- what can go wrong;
- from what possible cause;
- what action reduces the likelihood of it happening;
- what you do anyway, if it happens.
Five mistakes that reduce problem analysis to an exchange of opinions
The first mistake is chronological: asking why before knowing what needs to be explained.
This is the observation that the entire research started from: there is no point in inviting someone to "define the problem" before it is clear which of the open issues matters, and it is not fruitful to ask why a problem occurred before knowing exactly what has to be explained [1].
The second is leaving the "is not" column empty, out of haste or because it seems an idle question.
Without a point of comparison there are no distinctions, and without distinctions the meeting fills up with hypotheses that all carry the same weight.
The third is confusing priority with urgency: the ringing phone takes precedence in practice, while the three sorting criteria also weigh how the phenomenon is evolving and how much the effect costs [1] [3].
The fourth is stopping at the correction.
That this is a widespread flaw of method is suggested by the way the Bank of Italy measures it: in its 2019 Invind survey of Italian firms, the question on management practices grades the responses to a production problem as "fixed with no further action," "fixed with an action to prevent it from recurring" and "fixed, with a process to anticipate similar problems" [6].
The same study reports that family ownership is negatively correlated with the adoption of structured management practices — a descriptive correlation, not a causal explanation [6].
The fifth concerns the tool: using problem analysis when the question is a choice.
If the alternatives are already on the table and the reason for the deviation is known, continuing to ask why drags out the meeting without bringing it to a conclusion; what you need is the decision process, not the cause process.
A quick cross-check works for all five: if the meeting minutes contain people's names rather than verifiable conditions, the analysis has not been done.
If you want to place these steps within a broader process, you will find the map in the guide to business problem solving.
Limits and conditions of applicability
The method presupposes a standard: without a stated "what should happen," the deviation cannot be measured and the template stays half empty.
That is why it works better on phenomena that appeared on a certain date than on processes that never worked from the start, where there is no "before" to compare against.
The concepts cited come from field research carried out in the 1950s and 1960s, based on interviews with executives [1]: it is a reconstruction of effective practices, not an experimental measure of effectiveness.
All that is known of that research is the account the authors give of it in the book's introduction — six months spent asking managers from different industries what steps they actually took [1]. Neither the sample, the questionnaire nor the data appear to have been published, and no one has replicated it: the method should therefore be read for its internal consistency and for what it produces when applied, not as a verifiable finding.
The painting case is hypothetical and built for this article: it serves to show the procedure, not to estimate frequencies or results.
The weights in decision analysis remain the judgments of whoever assigns them, and a tidy grid does not turn an opinion into data.
FAQ
What is the Kepner-Tregoe method?
It is a set of four analytical processes — situation, problem, decision and potential problem analysis — developed by Charles Kepner and Benjamin Tregoe and published in 1965 in The Rational Manager [1].
The premise is that a problem is a deviation between what should happen and what does happen, to be described before it is explained [1].
What is the difference between Kepner-Tregoe and the 5 whys?
The 5 whys go down a chain of causes starting from a problem that has already been stated, whereas Kepner-Tregoe problem analysis works earlier: it bounds the field by comparing what the problem is with what it is not [1].
They are complementary steps: the first narrows, the second digs.
What does the "is / is not" template mean?
It means describing the deviation along four dimensions — identity, location, time and extent — and, for each one, also noting the comparable case that is not affected [1].
The differences between the two columns show where to look for the change that produced the effect.
How long does it take to fill in a template?
For a well-bounded problem, thirty or forty minutes with the people who saw the phenomenon and those who have access to the data are usually enough: this is an operational guideline from the editorial team, not a measured figure.
It takes longer when the numbers needed to fill in the "is not" column still have to be collected.
Operational summary
Defining the problem comes before explaining it: this is the rule that orders all the following steps.
The work begins by separating the open issues and assigning each one the process it needs, using three criteria: how pressing the timing is, how the phenomenon is evolving, how much the effect weighs.
For the chosen problem, you write a precise statement, with object, place, moment and extent, before any hypothesis.
The description is completed along the four dimensions in two columns, where the second gathers what is comparable and was not affected.
From the differences between the columns you derive the distinctive characteristics, and within those you look for the changes that occurred.
The cause hypothesis is stated as a testable proposition and tested against every row of the template: the one that holds is the one that explains both the presences and the absences.
When several viable paths remain, you move on to the decision, separating mandatory objectives from desirable ones and weighting the latter.
Before executing, you list the weak points of the plan with a preventive action and a contingency plan for each.
Conclusion
The Kepner-Tregoe method is not a technique for finding causes: it is a discipline of definition, and the cause arrives as the consequence of a description done well.
The "is not" column remains the move that sets it apart from any round of opinions: without a point of comparison there are no differences to question, and every hypothesis is worth as much as the others.
If you need to dig along a single chain after bounding the field, the natural next step is the 5 whys technique; if you notice that the plausible answers belong to different families, open the Ishikawa diagram first.
When, instead, the question is already a choice between alternatives, the criteria and weights are in the decision matrix, and the place of these steps within a single process is in the guide to business problem solving.
If you would like to receive the next in-depth articles in this cluster, you can sign up for the newsletter.
After a few months of filled-in templates, the subject of meetings changes: people stop discussing who made the mistake and start discussing what distinguishes the shift in which the defect appears from the one in which it does not.
It is a change of climate measured in hours not spent redoing work already done, and in decisions made only once.
The recurring problem remains the most expensive bill a company pays without noticing: defining it precisely is the first way to stop paying it.
Sources and references
[1] Kepner, C. H. and Tregoe, B. B., "The Rational Manager: A Systematic Approach to Problem Solving and Decision Making", McGraw-Hill Book Company, New York, 1965 (edition consulted: authorized Tata McGraw-Hill reprint, copyright © 1965). Full digitized text available at: https://archive.org/stream/in.ernet.dli.2015.133386/2015.133386.The-Rationale-Manager_djvu.txt
[2] Kepner, C. H. and Tregoe, B. B., "The New Rational Manager", Princeton Research Press, Princeton (NJ), 1981, 224 pp. (LCCN 80084367); updated edition "An Updated Edition for a New World", Princeton Research Press, ISBN 9780971562714. Catalog record: https://archive.org/details/newrationalmanag00char
[3] Schaffer, C. A. and McQuain, W. D., "Kepner-Tregoe", course notes for CS 2104 "Intro Problem Solving in Computer Science", Virginia Polytechnic Institute and State University, 2010-2012. Available at: https://courses.cs.vt.edu/cs2104/Fall12/notes/KTNotes5.pdf
[4] ISTAT, "Censimento permanente delle imprese 2023: primi risultati", press release, November 14, 2023 (reference year 2022; about 280,000 responding companies, representative of 1,021,618 companies with at least 3 employees). Available at: https://www.istat.it/comunicato-stampa/censimento-permanente-delle-imprese-2023-primi-risultati/ — PDF: https://www.istat.it/it/files/2023/11/REPORTCensimprese.pdf
[5] Treccani, entry "problèma", Vocabolario on line, Istituto della Enciclopedia Italiana. Available at: https://www.treccani.it/vocabolario/problema/
[6] Baltrunaite, A., Formai, S., Linarello, A. and Mocetti, S., "Ownership, governance, management and firm performance: evidence from Italian firms", Banca d'Italia, Questioni di Economia e Finanza (Occasional Papers) no. 678, March 2022 (Invind 2019 survey, section on management practices). DOI 10.32057/0.QEF.2022.678. Available at: https://www.bancaditalia.it/pubblicazioni/qef/2022-0678/index.html — PDF: https://www.bancaditalia.it/pubblicazioni/qef/2022-0678/QEF_678_22.pdf